Figure 5.
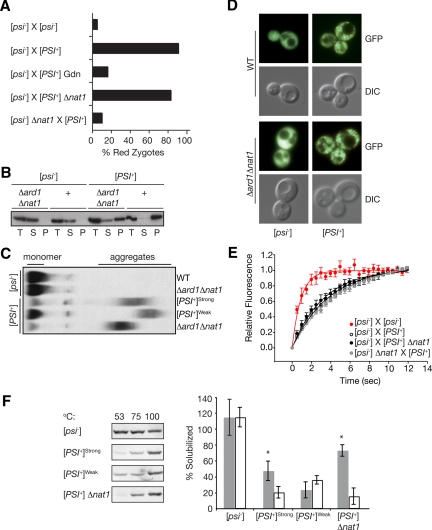
NatA modulates [PSI+] propagation by ensuring efficient conversion of soluble Sup35 to the prion form. (A) The percentage of zygotes displaying red nuclear fluorescence from a PGPD GST-UGA-DsRed-NLS reporter were scored following the indicated crosses: [psi−] (SY1163 or SY1181) × [psi−], [psi−] (SY1163 or SY1181) × [PSI+] untreated or in the presence of GdnHCl, [psi−] (SY1163) × [PSI+]Δnat1 (SY356), [psi−]Δnat1 (SY1180) × [PSI+]; n ≥ 37. (B) Lysates from Δard1Δnat1 (SY319, SY978) or wild-type (WT) [PSI+] and [psi−] strains were fractionated by centrifugation and analyzed by SDS-PAGE and immunoblotting for Sup35. (C) Lysates from wild-type (WT, [PSI+]Strong, [PSI+]Weak) or Δard1Δnat1 (SY319, SY978) strains were analyzed by semidenaturing detergent agarose gel electrophoresis (SDD-AGE) and immunoblotting for Sup35. (D). Shown are fluorescent (GFP) and bright-field (DIC) images of wild-type (WT, SY80, and SY84) and Δard1Δnat1 (SY1068 and SY330) strains expressing a Sup35-GFP fusion as the sole copy of Sup35. (E). Wild-type (SY360 or SY1370) or Δnat1 (SY1371) [psi−] strains expressing Sup35-GFP were mated to unmarked wild-type (74D-695) or Δnat1 (SY356) [PSI+] strains, and the resulting zygotes were analyzed by FRAP. The recovery half-times (t1/2) were determined by curve-fitting as previously described (Satpute-Krishnan et al., 2007): [psi−] × [psi−] (t1/2 = 0.7 s, R2 = 0.98, n = 10); [psi−] × [PSI+] (t1/2 = 3.1 s, R2 = 0.96, n = 60); [psi−] × [PSI+] Δnat1 (t1/2 = 2.7 s, R2 = 0.95, n = 60); and [psi−] Δnat1 × [psi−] (t1/2 = 3.3 s, R2 = 0.98, n = 71). Error bars, SEM. (F). Lysates from wild-type (74D-695) [psi−], [PSI+]strong, or [PSI+]weak variants or from a [PSI+] Δnat1 mutant were incubated in the presence of SDS at 53, 75, or 100°C before SDS-PAGE and immunoblotting for Sup35 (left). Quantification of the immunoblots, expressed as the percentage of Sup35 at 53°C (white) or 75°C (gray) relative the 100°C sample is indicated in the graph on the right. n ≥ 6; error bars, SD; *p < 0.001.

