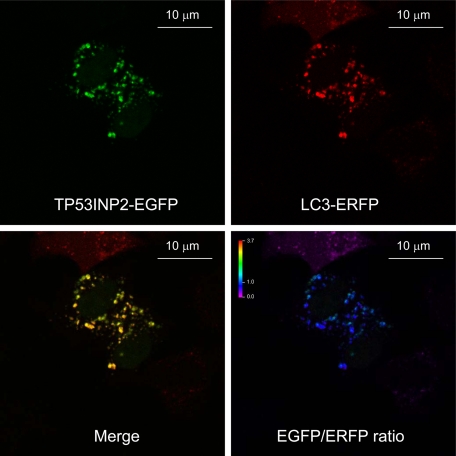
Figure 6.
Increase in the number of double-positive dots after treatment with bafilomycin A1 during starvation, in cell cotransfected with TP53INP2-EGFP and LC3-ERFP. The EGFP/ERFP ratio of intensities is shown (bottom right). The value of the ratio is given by color scale, as indicated on the top left.

