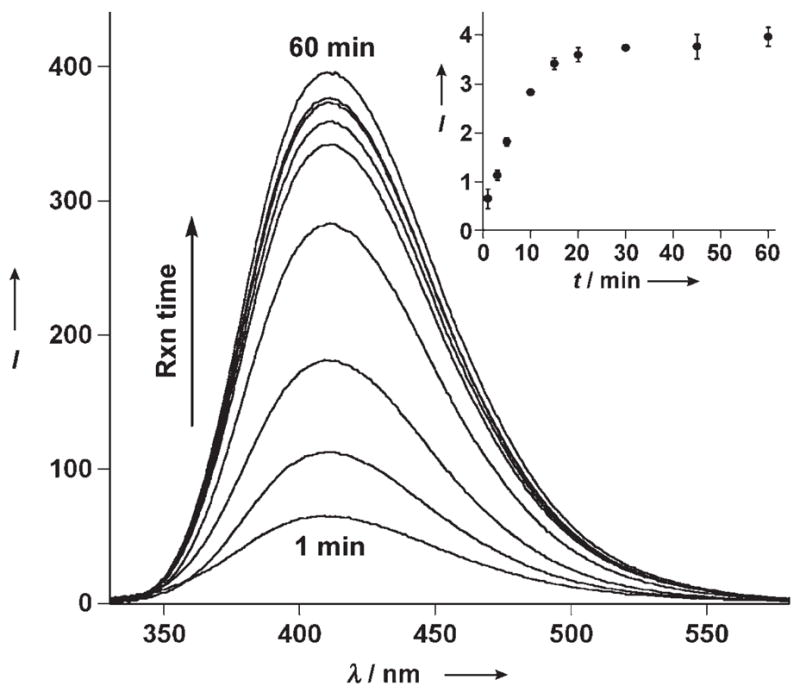
Figure 5.

Saporin-catalyzed depurination reaction monitored by fluorescence as a function of time. At regular time intervals, aliquots of the toxin-mediated depurination reaction of RNA 1 were hybridized to RNA 6 (1:0.9 ratio) in Tris buffer (30 mM, pH 6.0), NaCl (100 mM), MgCl2 (2 mM), and emission spectra were recorded (λex = 304 nm). Inset: A plot of intensity at 410 nm versus time depicting saturation kinetics from the formation of the highly emissive 2 a·6.[18]
