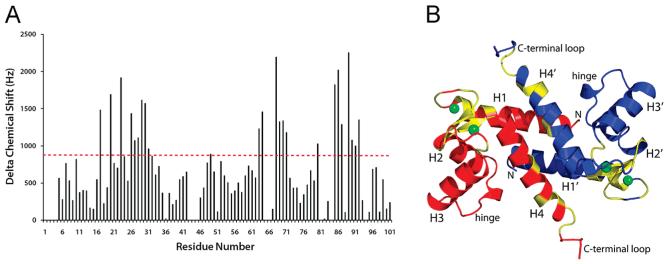
Figure 2.
Chemical shift perturbations following the addition of Ca2+ to apo-S100A4. (A) Bar graph of the cumulative 1H, 15N, and 13C chemical shift perturbations observed per residue upon the addition of Ca2+ to apo-S100A4. (B) Ribbon diagram of Ca2+-S100A4 showing the subunits in red and blue. Residues highlighted in yellow exhibited the largest perturbations (as per the dashed red line at 900 Hz in panel A).

