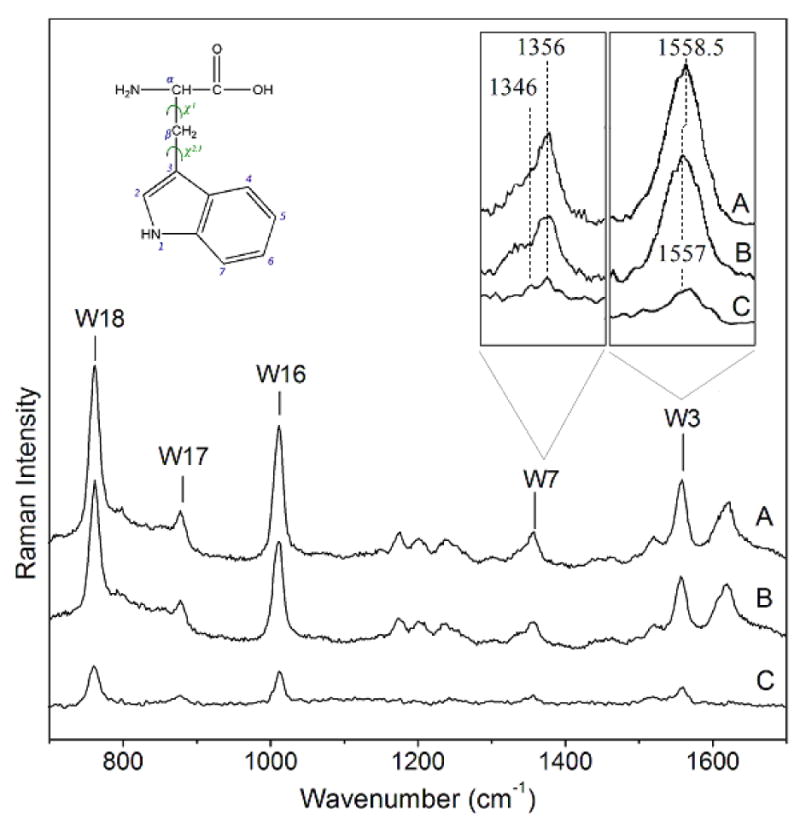
Figure 3.

The 229 nm resonance Raman spectra of A) Gal-1–Lac, and B) Gal-1. The intensities were normalized with respect to the Tyr Y8a band. C) Difference spectrum obtained by A-B. Note that the difference spectrum shows only Trp signals. In insets, W3 band shift can be better visualized and it is clearly shown that the W7 I1356/I1346 ratio decreases from A to B (Gal-1 bound to unbound state, respectively).
