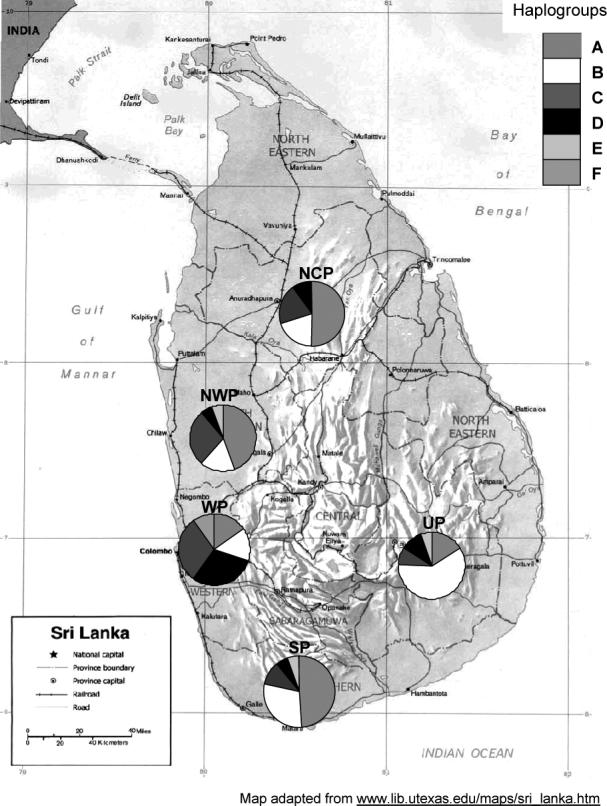
Figure 1.

Sampling sites in Sri Lanka. NCP, NWP, SP, UP, and WP represent north central province, north western province, western province, uva province and southern province, respectively. Regional frequency distribution of the haplogroups is shown by each pie chart. The number of birds sampled from each region is presented in Table 2.
