
Figure 2. Example of 23 GO terms in which enriched up-regulated genes have an over 2-fold difference of enrichment percentage compared to enriched down-regulated genes.
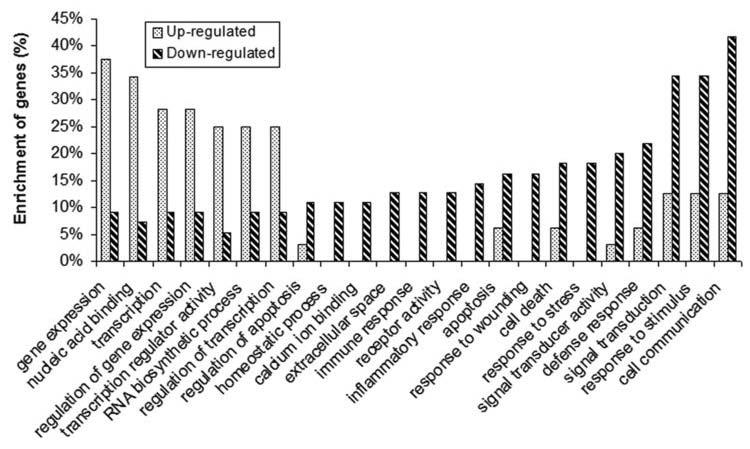
The percentages of the up- and down-regulated genes relative to their total number (i.e., 32 and 55, respectively) in each GO term are shown in the plot for a direct comparison.