
Figure 1.
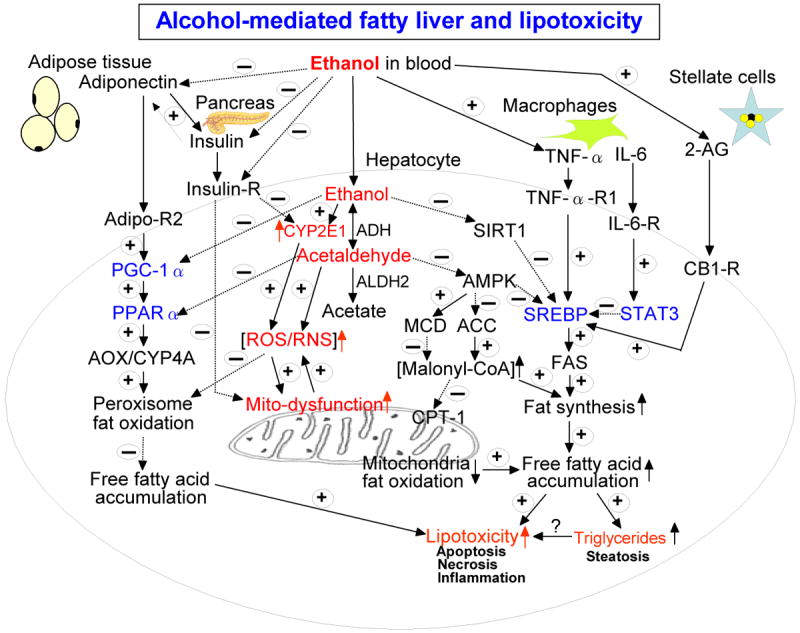
Schematic diagram of the major pathways of alcoholic fatty liver and lipotoxicity. Besides the major pathways indicated in this diagram, ethanol intake is also known to promote fat transport into the liver from peripheral tissues while ethanol inhibits fat export from the liver. Adiponectin also activates AMPK, resulting in decreased SREBP and ACC activities while it suppresses functions of stellate cells. TNFα decreases the level of adiponectin. These cross-talk exist between various factors, resulting in different levels of fat accumulation in the liver. The positive signs with solid lines represent activation and/or up-regulation of the down-stream targets while the negative signs with broken lines indicate the opposite effects. Transcriptional factors are shown in blue color while the molecules/conditions promoting oxidative/nitrosative stress are marked in red color. Abbreviations used: ADH, alcohol dehydrogenase; ALDH2, mitochondrial aldehyde dehydrogenase; CYP2E1, ethanol-inducible cytochrome P450 2E1; ROS, reactive oxygen species; RNS, reactive nitrogen species; insulin-R, insulin receptor in hepatocytes; Sirt1, sirtuin1; AMPK, AMP-activated protein kinase; ACC, acyl-CoA carboxylase; MCD, malonyl-CoA decarboxylase; CPT-1, carnitine palmitate transferase-1; TNFα-R1, TNFα receptor 1 in hepatocytes; SREBP, sterol regulatory element binding protein; FAS, fatty acid synthase; IL-6, interleukin-6; IL-6-R, IL-6 receptor; 2-AG, 2-arachidonoylglycerol; STAT3, signal transducer and activator of transcription 3; CB-1-R, endocannabinoid receptor 1; Adipo-R2, adiponectin receptor 2 in hepatocytes; PGC-1α, peroxisome proliferator activator receptor γ co-activator protein α; PPARα, peroxisome proliferator activator receptor α; AOX, acyl-CoA oxidase; CYP4A, cytochrome P450 4A.