
FIGURE 4.
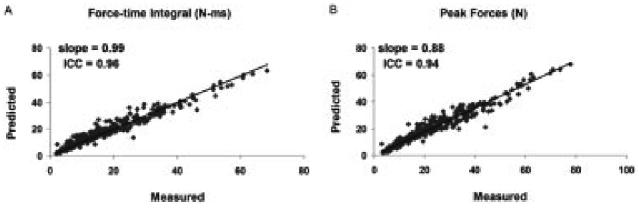
Plots of measured versus predicted force-time integrals (A) and peak forces (B) for all stimulation trains for 10 subjects. Trendlines were plotted using an intercept of zero and the slopes were reported.
Official websites use .gov
A
.gov website belongs to an official
government organization in the United States.
Secure .gov websites use HTTPS
A lock (
) or https:// means you've safely
connected to the .gov website. Share sensitive
information only on official, secure websites.
Plots of measured versus predicted force-time integrals (A) and peak forces (B) for all stimulation trains for 10 subjects. Trendlines were plotted using an intercept of zero and the slopes were reported.