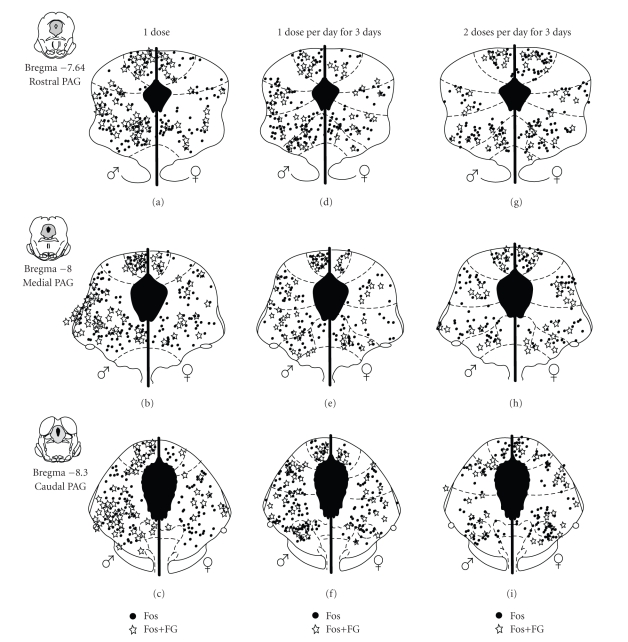
Figure 4.
Distribution of PAG cells expressing Fos (black circles) and cells retrogradely labeled from the RVM expressing Fos (stars) following: (a)–(c) one 5 mg/kg dose of morphine; (d)–(f) one 5 mg/kg dose of morphine per day for three consecutive days; (g)–(i) or two 5 mg/kg doses of morphine per day for three consecutive days in males (left) and females (right) at three representative rostrocaudal levels of the PAG.

