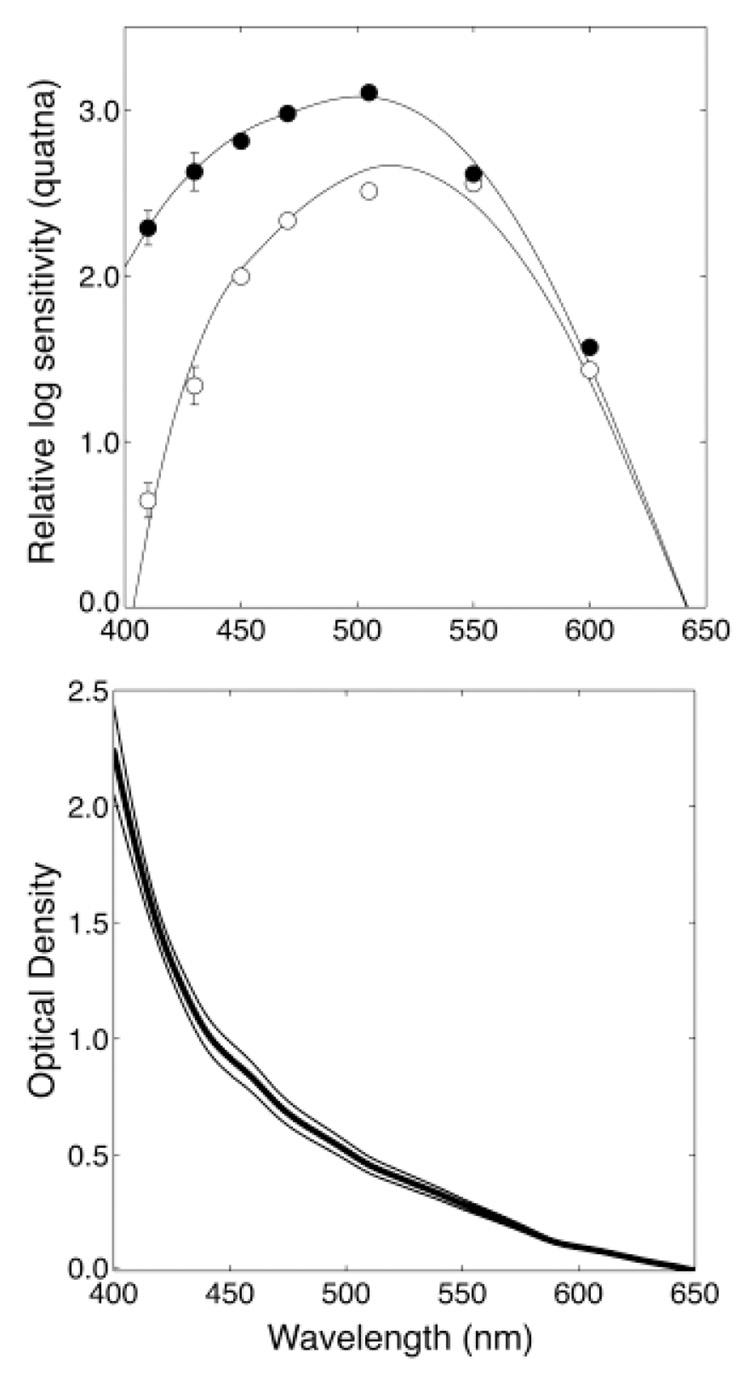
Fig. 1.
The top panel shows scotopic threshold measurements for a typical cataract patient before surgery (open circles) and after surgery (closed circles). The curves show model fits (see text for details). Error bars are ±1 S.E.M. The bottom panel shows the mean optical density difference (thick black line) between the presurgery and postsurgery absorption curve fits for four patients with cataracts rated as 2–3+. The thin lines show ±1 standard deviation.

