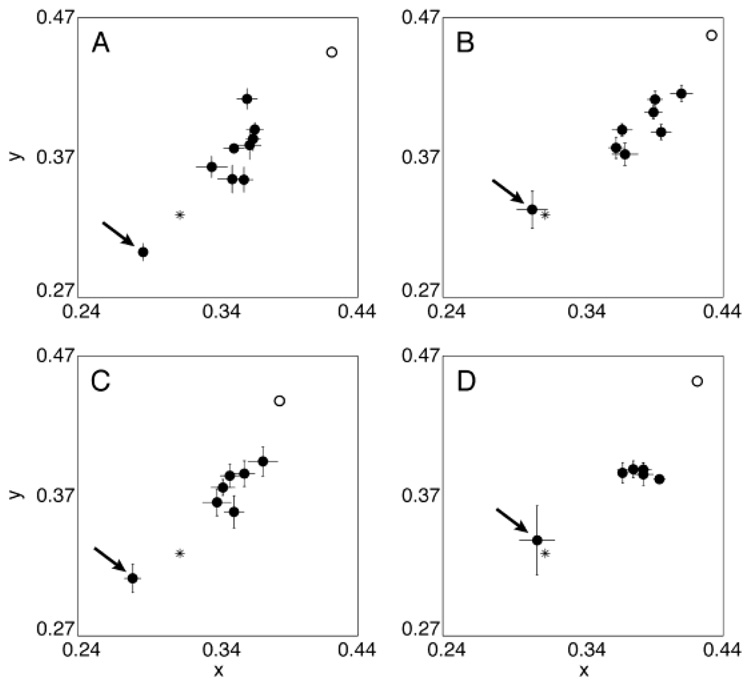
Fig. 3.
Achromatic settings made for all four observers using the test eye over a period of 1 year for observer A and 6 months for the other three observers. The presurgery setting is indicated by an arrow. The open circle shows the equivalent presurgery setting calculated using the lens-absorption difference results. The first setting postsurgery tends to be reasonably close to the equivalent presurgery settings but already shows some adaptation. Subsequent settings slowly migrate toward a typical white point (e.g. CIE Illuminant D65 shown by an asterisk). Error bars are ± 1 S.E.M.

