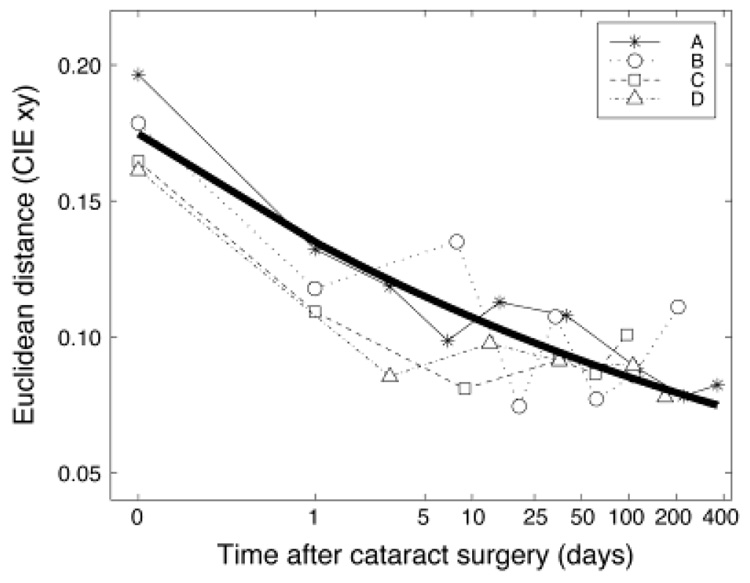
Fig. 4.
The shift in achromatic settings over time for the four observers. The x-axis shows the days from surgery on a log scale. Day 0 is the adjusted presurgery using the lens-absorption measurements. The y-axis shows the Euclidean distance in CIE xy space from D65. The bold curve shows the mean of the best-fitting decaying exponential functions for each observer.

