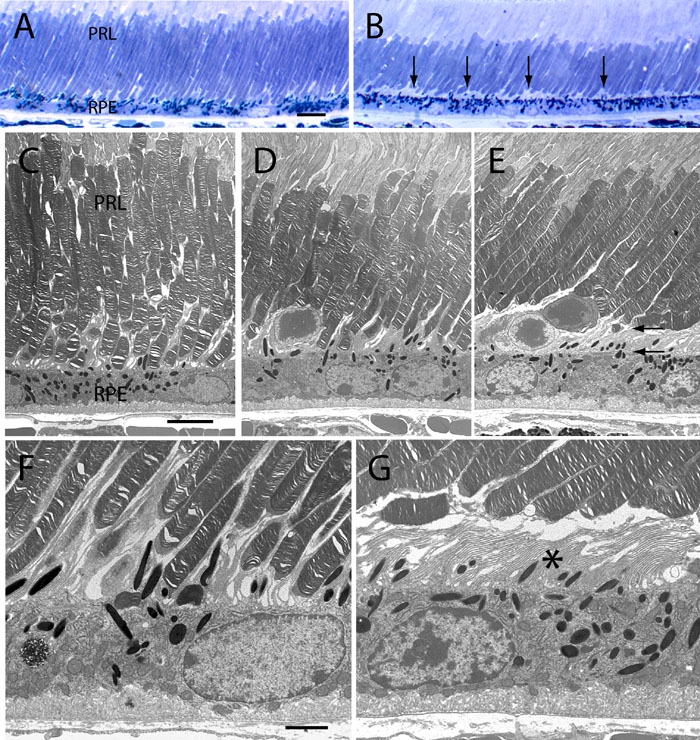
Figure 10.

Light and electron micrographs of the RPE-neural retina boundary from 5 week-old wild-type and p27Kip1-null mice. A, C, and F represents p27+/+ and B, D, E, and G represents p27-/- retinal tissue. Comparison of images from semi-thin sections reveal that, while the RPE and neural retina of normal eyes are contiguous (A), variable-sized gaps appear between these two tissues in mutant eyes (B, arrows). In electron micrographs, direct contact is seen between the tips of rod photoreceptors and the apical epithelial surface both in the normal retina (C), and in some regions of the mutant retina (D). However, in other regions of the mutant retina, these two cell types are often separated from one another by a variable space (between arrows in E). In such regions, epithelial microvillous processes are often seen to lose their normal close interdigitation with rod outer segments. This results in a partial or complete separation of RPE and neural retina at their boundary, with the intervening space taken up largely by microvilli (asterisk in G). Although displaced rod nuclei are occasionally observed at the mutant RPE-neural retina interface, most outer segments appear structurally normal. Furthermore, the morphology of the epithelial cell layer in thin sections is generally comparable in the two types of animals. RPE represents retinal pigment epithelium; PRL represents photoreceptor layer. A and B: Scale bar represents 10 μm. C, D, and E: Scale bar represents 5 μm. F and G: Scale bar represents 2 μm.
