
Figure 5. Average parameter estimates.
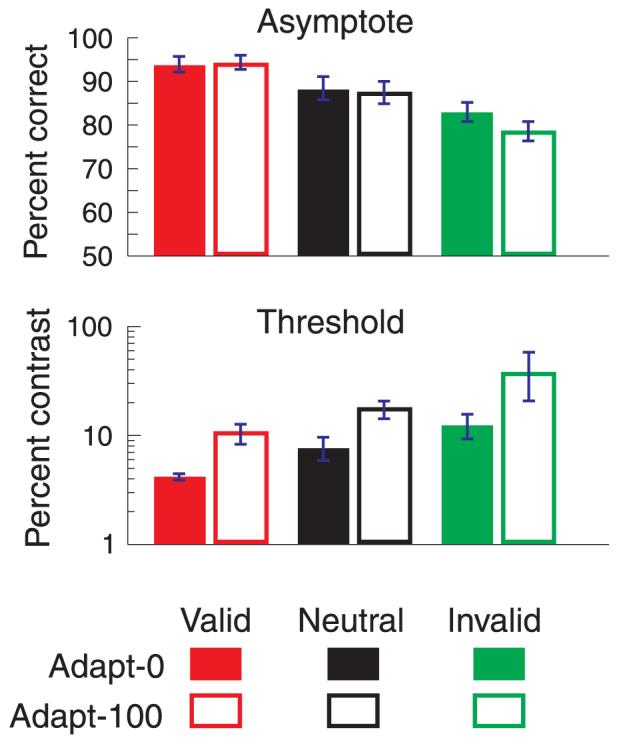
Top graph represents the average of the asymptote parameters across the three observers. Bottom graph represents the average of the threshold parameters across the three observers. Data from the adapt-0 condition have filled bars; data from the adapt-100 condition have outlined bars. Error bars are ±1 SEM. Effect of attention: Asymptotes increase as a function of attentional allocation (valid > neutral > invalid) in both adaptation conditions by the same amount. Thresholds decrease (valid < neutral < invalid) in both adaptation conditions by the same amount. Effect of adaptation: Asymptotes in the adapt-0 condition (outlined bars) and the adapt-100 condition (filled bars) do not change; compare the same-color bars in the top graph. Thresholds increase between the adapt-0 condition (filled bars) and the adapt-100 condition (outlined bars); compare the same-color bars in the bottom graph.