
Figure 4.
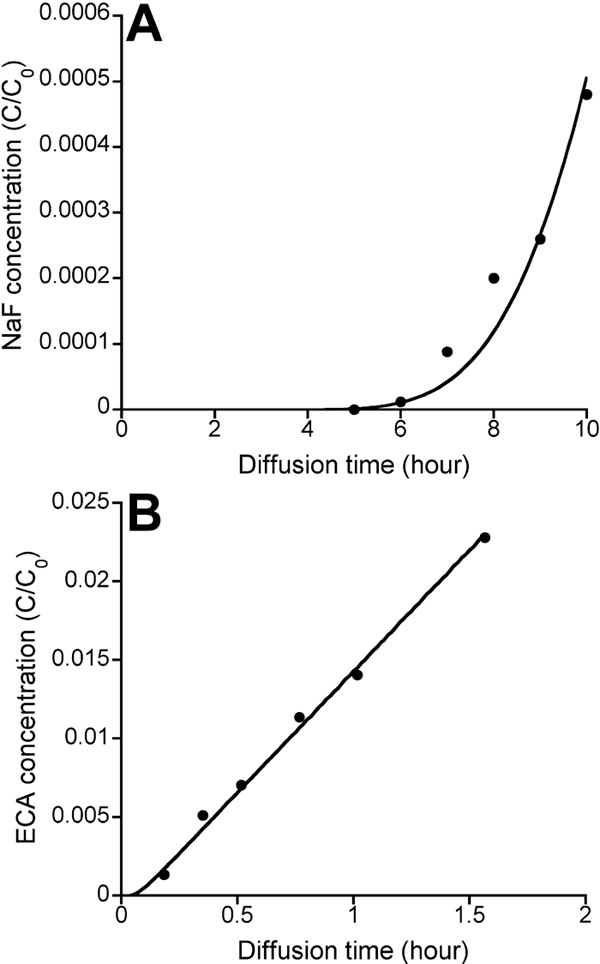
Temporal profiles of sodium fluorescein (NaF) and ethacrynic acid (ECA) concentrations in the choroid chamber. A: A typical temporal profile of NaF concentration in the choroid chamber. B: A typical temporal profile of ECA concentration in the choroid chamber. The symbols denote the experimental data normalized by the initial concentrations of NaF (5 mg/ml) and ECA (0.6 mM), respectively, in the episcleral chamber. The solid curves show the curve-fitting based on the mathematical model described in the Methods section.