Fig. 3.
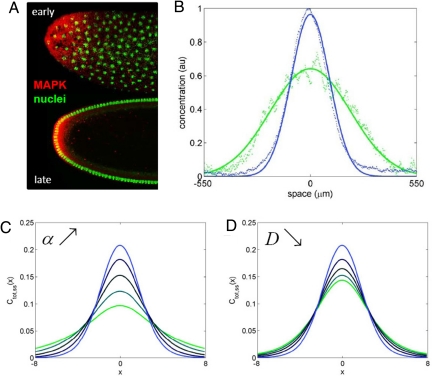
Dynamics of MAPK phosphorylation profiles in the terminal system. (A) Fluorescent images of nuclei (green) and phosphorylated MAPK (red) at 2 different nuclear densities. (B) Quantified gradients of total (nuclear and cytoplasmic) phosphorylated MAPK. The green/blue curves show the patterns of MAPK phosphorylation at nuclear cycles 10 and 14, respectively. Increase in the nuclear density amplifies the total level of MAPK phosphorylation near the poles of the embryo and attenuates it in the rest of the system. (C) Increase in the nuclear trapping rate sharpens the profile of Ctot,ss(2) (x), computed with Eqs. 53 and 40: α = 0.05, 0.1 0.2, 0.4, 0.8 (green to blue curves, respectively). Other parameters: kim zbe 2, km = 0, β = 1, σ = 1.5, and D = 0.5. (D) Decrease in the diffusivity sharpens Ctot,ss(2) (x). D = 2.5, 2, 1.5, 1, and 0.5 (green to blue curves, respectively), α = 0.8, other parameters as in C.

