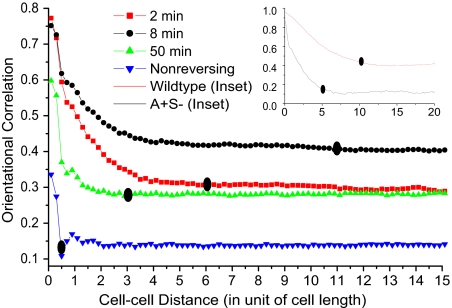
Fig. 5.
The orientational correlation functions for nonreversing cells and for reversal periods of 2, 8, and 50 min are plotted against the cell-cell distance for an A+S− mutant after 400 min of simulation. The two curves in the inset are the orientation correlation functions calculated for wild-type and A+S− cells outside the initial domain having an 8 min reversal period. The background level for the A+S− (Inset) is smaller than the main figure because cells outside the initial domain have a lower density than cells at the very edge in the steady state. The correlation distances are shown by solid ovals. The cell–cell distance is given in units of cell length, where 1 cell length = 5 μm.

