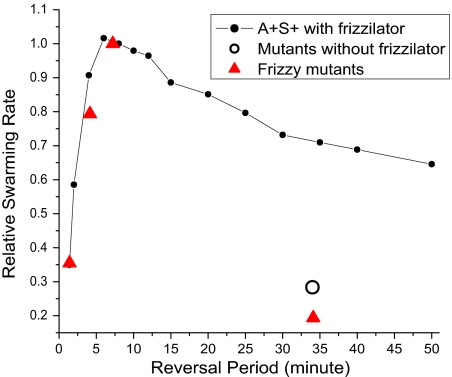
Fig. 6.
Dependence of the swarm expansion rate on the reversal period. Observed expansion rates for WT and 3 deletion frizzy mutants (red triangles) are compared with those computed from the model (all are relative values). Measurement of the swarm expansion rate is described in the SI.

