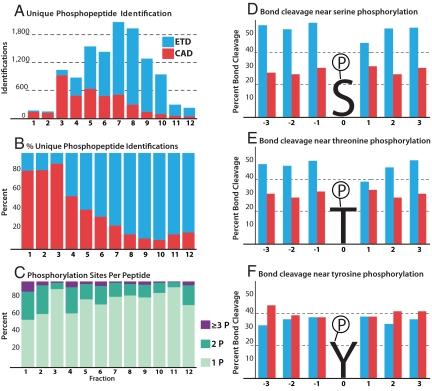
Fig. 2.
Summary of phosphopeptide identifications and assessment of MS/MS spectral quality. ETD identifications are shown in blue and CAD in red. (A) The number of unique identifications in each fraction and the fragmentation method by which it was identified or best identified if discovered by both. (B) The percentage of peptides identified by either CAD or ETD in each fraction. (C) The number of phosphorylation sites per peptide across all fractions. (D–F) MS/MS spectral quality can be assessed by examining the percentage of backbone bonds cleaved via either ETD (blue) or CAD (red) for 3 amino acids up- or downstream of a phosphorylated serine (D), threonine (E), or tyrosine (F) residue.

