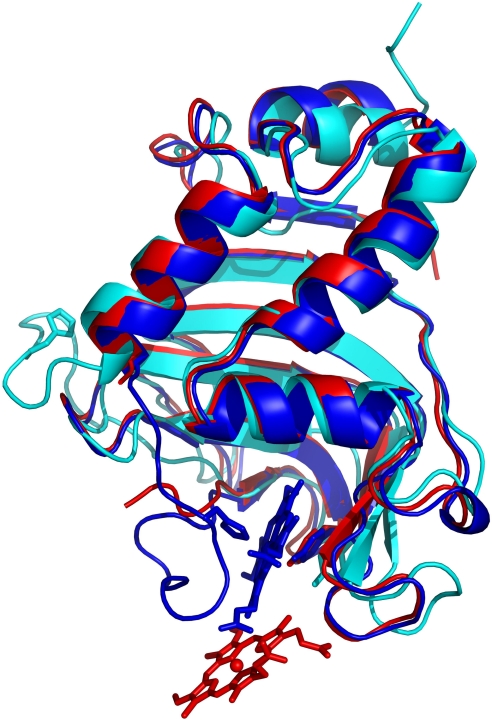
Fig. 2.
Superimposed structures of holoHasA (8) (blue), apoHasA (39) (cyan), and HasA in the HasA∼HasR∼heme complex (red) shown as ribbon models. The hemes of the holoHasA and the HasA∼HasR∼heme structures are represented as wire frame models with the ferric iron indicated as a sphere. The superposition shows the translocation of the heme from holoHasA into the HasA∼HasR∼heme complex. The distance between the ferric iron atoms is 9.2 Å.

