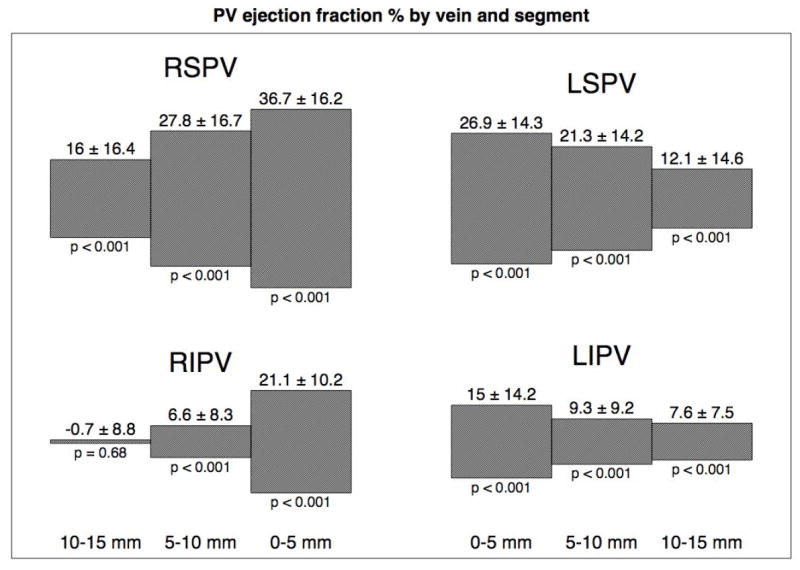
Figure 4.

The contraction of each 5 mm pulmonary vein segment (0 to 5 mm, 5 to 10 mm and 10 to 15 mm) is shown graphically for the four pulmonary veins. The significance value is given below the plot (Student’s T-test ejection fraction is 0). There is more contraction in the superior veins, which appears to extend further into the pulmonary veins. The right inferior pulmonary vein appears to have some significant ostial contraction with minimal extension deeper into the vein.
