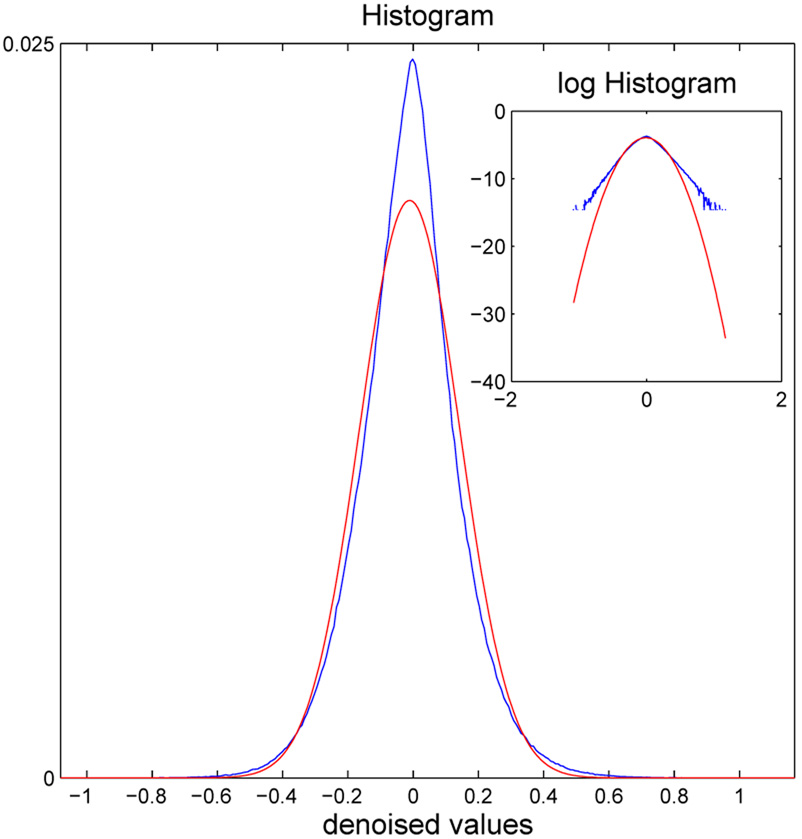
Figure 3.
Motivation for permutation testing of activation statistics after denoising by Bayesian shrinkage in the wavelet domain. The empirical histogram of denoised statistics (blue line) can be compared to the best-fitting Gaussian distribution (red line). It is clear, especially from the inset plots of these curves on a log scale, that the empirical distribution is more heavy-tailed than the Gaussian distribution, implying that hypothesis testing based on critical values in the tails of the Gaussian distribution would likely lead to uncontrolled Type I error.

