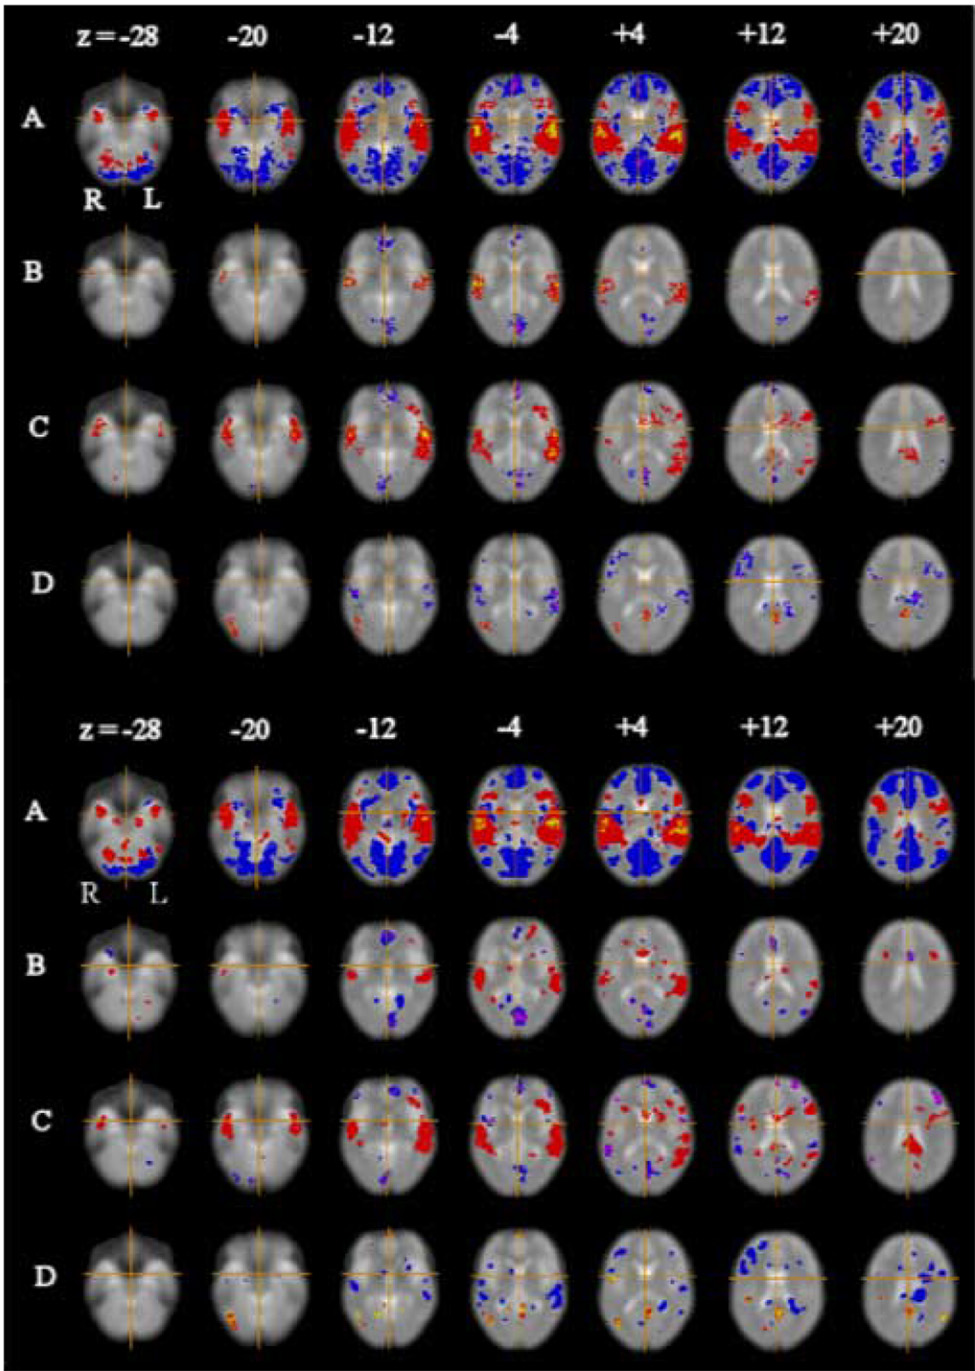
Figure 5.
Activation maps for language processing experiment. Top panel: results previously reported by Suckling et al (2004), using a permutation test in the spatial domain. Bottom panel: results obtained by permutation testing of activation statistics in the spatial domain after Bayesian denoising in the wavelet domain. In both panels selected axial slices (at Talairach z-coordinates −28, −20, −12, −4, +4, +12, and +20 mm) are shown for (A) average activation difference between language processing and baseline conditions; (B) main effect of speaker novelty; (C) main effect of sentence novelty; and (D) interaction between sentence and speaker novelty. In both panels, the left-hand side of the image is the right-hand side of the brain and the crosshairs show the origin of the x and y coordinates in Talairach space. Red regions of A are where language processing conditions elicited greater response than baseline conditions and vice versa for blue regions. Red regions of B are where novel speaker blocks elicited greater response than familiar speaker blocks and vice versa for blue regions. Red regions of C are where novel sentence blocks elicited greater response than familiar sentence blocks and vice versa for blue regions. Red regions of D show where response to familiar sentence blocks was specifically increased when spoken by a novel speaker and response to novel sentence blocks was specifically decreased when spoken by a novel speaker and vice versa for blue regions. Type I error for the spatial permutation test (panel A) controlled the expected number of false positive tests at less than one per map; type I error for the permutation test after wavelet denoising (panel B) controlled the false discovery rate at α FDR =0.01 for each map.

