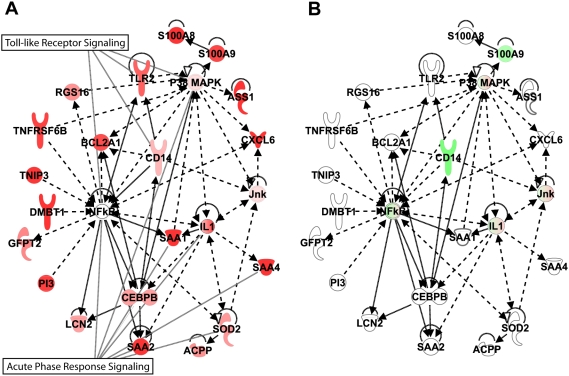
Figure 6. Expression of genes associated with acute phase response/NFkB signaling in colon of PT (A) and AGM (B).
Ingenuity network analysis showing connection between genes associated with NFkB signaling overlaid with expression data from in-silico pooled samples of PT colon (A) or AGM colon (B) at day 10. Genes shown in red and green represent increased or decreased expression, respectively, relative to pre-infection levels.

