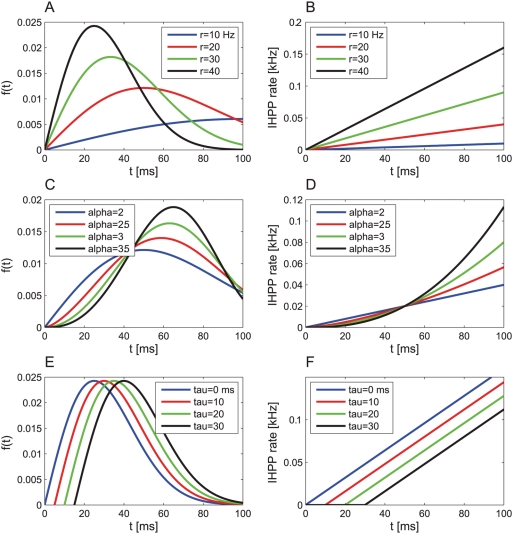
Figure 1. Three examples showing the effects of the scale parameter (a,b),
the shape parameter (c,d), and the delay parameter (e,f) on the
first spike time probability density,  , (left column) and the PSTH rate,
  , of a corresponding inhomogeneous Poisson process
(right column).
The PSTHs were taken to be of the form of  (compare with equation 5), and
  is obtained via the relation of equation (6). The
parameters used to generate the plots are as follows. For a and b:
  ,
,  , and
, and  as appears on the figure. For (c,d):
  ,
,  , and
, and  as appears on the figure. For (e,f):
  ,
,  , and
, and  as appears on the figure.

