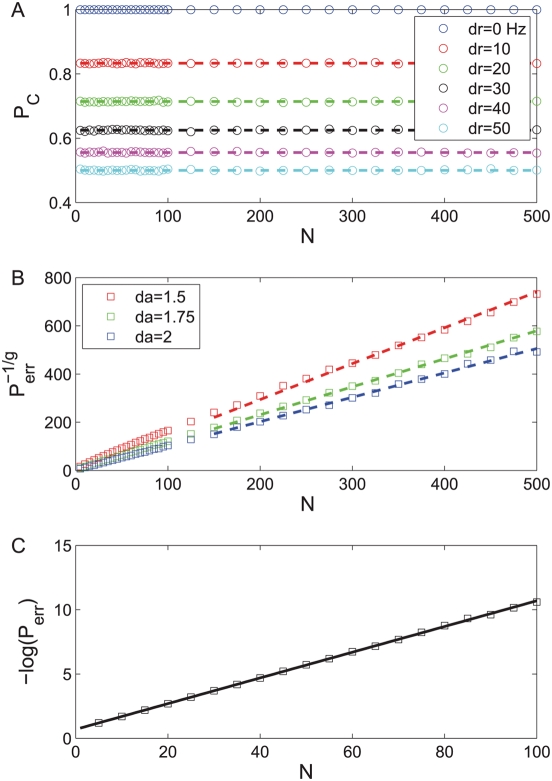
Figure 2. tWTA performance in a 2AFC discrimination task between stimulus
0° and  in a two-column model as function of the number of
cells in the population.
Open symbols show numerical estimation of the tWTA performance as
obtained by averaging the probability of correct discrimination over
106 realizations of the stochastic neural responses.
Probability distribution of first spike times followed an IHPP with
the following PSTHs. (a) Scale parameter tuning:  with
with  and
and  from top to bottom. The dashed lines show the
analytical prediction of equation (9). (b) Shape parameter tuning:
  with
with  ,
,  and
and  from top to bottom. The tWTA performance is shown
in terms of
  where
where  . The dashed lines show linear regression lines in
keeping with the prediction of equation (12). (c) Delay parameter
tuning:
  with
with  ,
,  and
and  . The tWTA performance is shown in terms of minus
the log of the error rate. The solid line shows the analytical
prediction of equation (15).

