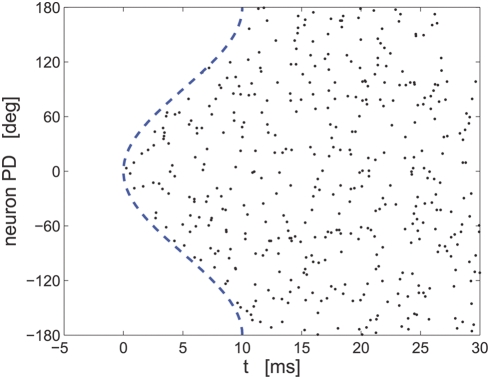
Figure 6. Simulation of a hypercolumn population raster plot.
Spiking responses of 360 cells coding for an external stimulus  during a single trial are shown. Each line shows
the spike-times of a single cell. The cells are arranged according
to their preferred directions. Spike times of cell with preferred
direction
  was modeled by an IHPP with PSTH
  , where
  is the rate and the latency function is
  . The dashed line shows
  .
.

