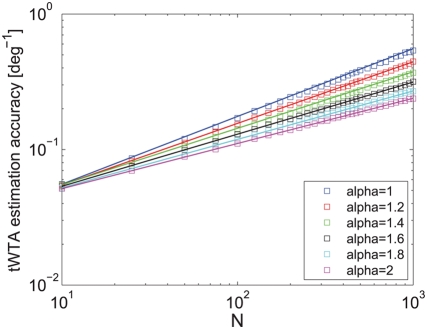
Figure 7. Estimation accuracy of the tWTA readout in a hypercolumn model.
The accuracy of the tWTA readout, in terms of one over the squared
estimation error of estimating  , is plotted as a function of the population size,
in an IHPP hypercolumn population model, equation(30). The latency
tuning was modeled by
  (where
  is measured in radian) with
  from top to bottom. Accuracy was measured by
averaging the squared estimation error over 10,000 trials of
simulating the neuronal stochastic response (squares). The solid
lines show the analytical fit using equation (33).

