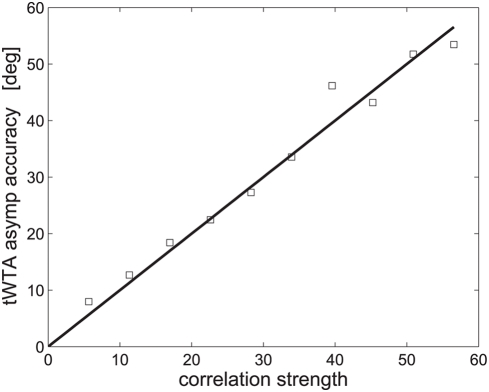
Figure 9. Effect of correlations on the asymptotic tWTA estimation accuracy in a hypercolumn model.
tWTA accuracy, in terms of the root mean square estimation error,  , is shown as a function of the
correlations' strength,
  , in a hypercolumn model, as defined in section
‘effect of correlations on the tWTA estimation
accuracy’, see equation (34). The solid line shows the
analytical asymptotic value, equation (35). Open squares show the
numerical estimation of the asymptotic value as calculated by
averaging the tWTA estimation error over 100 trials in a hypercolumn
model of
  cells. The latency function that was used was:
  . To minimize the effect of finite
  , an extremely high firing rate of
  was used in the IHPP simulations.

