
Fig. 2.
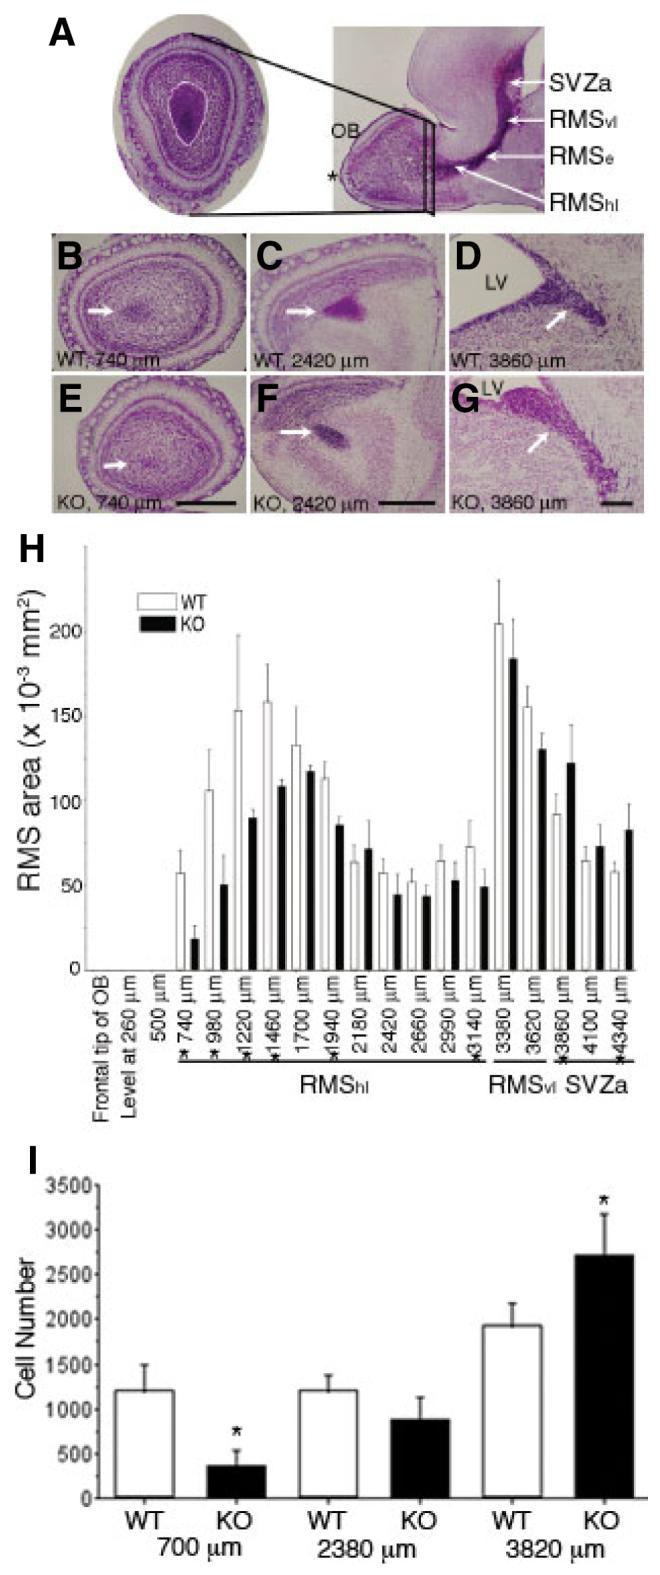
Altered histoarchitecture of the rostral migratory stream (RMS) of ADAM2 knockout (KO) mice (A) The RMS is distinguished by the intense Nissl staining in this parasagittal view of a P10 mouse forebrain (right). The asterisk indicates the frontal tip of the olfactory bulb (OB). The area of the RMS from wild-type (WT) and KO P10 mice was estimated from 20-μm-thick Nissl-stained, serial frontal sections derived from the frontal tip of the OB to the anterior part of the subventricular zone (SVZa; left). Areas of the RMS (demarcated by the white line) were measured on these frontal sections at 240 μm intervals. The RMS starts at the SVZa, then descends as the vertical limb (RMSvl), and finally becomes the horizontal limb (RMShl) near the OB. The elbow of the RMS (RMSe; Pencea & Luskin, 2003) is the junction between the RMSvl and the RMShl. (B—D) WT. Representative sections at the levels of 740 μm (end portion of the RMS), 2420 μm (RMShl, which denotes the horizontal limb region of the RMS near the OB) and 3860 μm (SVZa) from the frontal tip of the OB are shown. The RMS or SVZa (arrows) are characterized by a high cellular density at the center of the OB, or adjacent to the lateral ventricle (LV), respectively. (E—G) KO. Sections of the same level shown in (B—D). In each photograph (B—G), the right side is toward the dorsal part of the forebrain. Scale bar: 500 μm. (H) The RMS areas from the WT and the KO were compared between the same levels from the frontal tip of the OB to the SVZa. Each value represents the mean ± SD (N = 4 from four mice). The differences between the area of WT and KO at the levels (indicated by asterisks) were significant (P < 0.05). (I) The number of polysialic acid (PSA)-positive cells was counted in the RMS of WT and KO mice, and compared at the same distance from the tip of the OB to the SVZa. Each value represents the mean ± SD (N = 4 from four mice). The differences in cell number at the 700 μm and 3820 μm levels are significant (indicated by asterisks, P < 0.05).