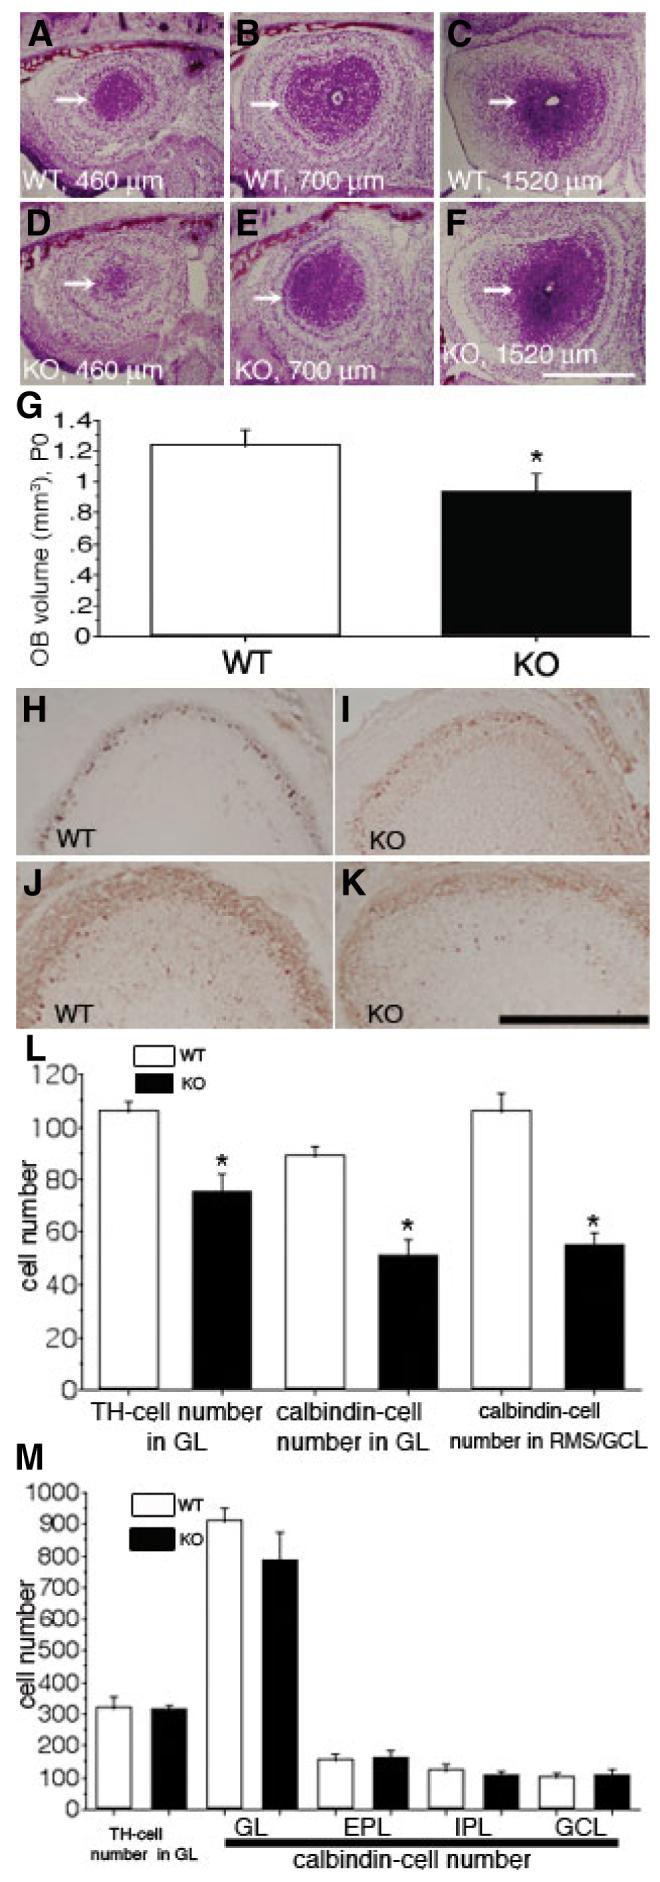
Fig. 3.

ADAM2 affects the size of the olfactory bulb (OB) at an early developmental stage. (A—C) Wild-type (WT) mice at P0. Representative, Nissl-stained sections at the level of 460 μm, 700 μm and 1520 μm from the frontal tip of the OB are shown; rostral migratory stream (RMS)—granular cell layer (GCL) (arrows). (D—F) Knockout (KO) mice at P0. Sections are at the same levels shown in (A—C). (G) The OB volume from the WT and the KO were compared. Each value represents the mean ± SD (N = 5 from five mice); the difference in volume of the OB between WT and KO is=significant (indicated by asterisk, P < 0.05). (H and I) WT (H) and KO (I) OB from P0 mice stained with an anti-tyrosine hydroxylase (TH) antibody. (J and K) WT (J) and KO (K) OB from P0 mice stained with an anti-calbindin antibody. (L) The difference in the numbers of TH- and calbindin-positive cells from the WT and KO mice at P0 are significant (indicated by asterisks, P < 0.05); each value represents the mean ± SD (N = 4 from four mice). (M) The numbers of TH-and calbindin-positive cells from the WT and KO mice at P30 were compared. Each value represents the mean ± SD (N = 4 from four mice), and is not statistically significantly different. EPL, external plexiform layer; GL, glomerular layer; IPL, internal plexiform layer. Scale bar: 500 μm (A—F); 250 μm (H—K).
