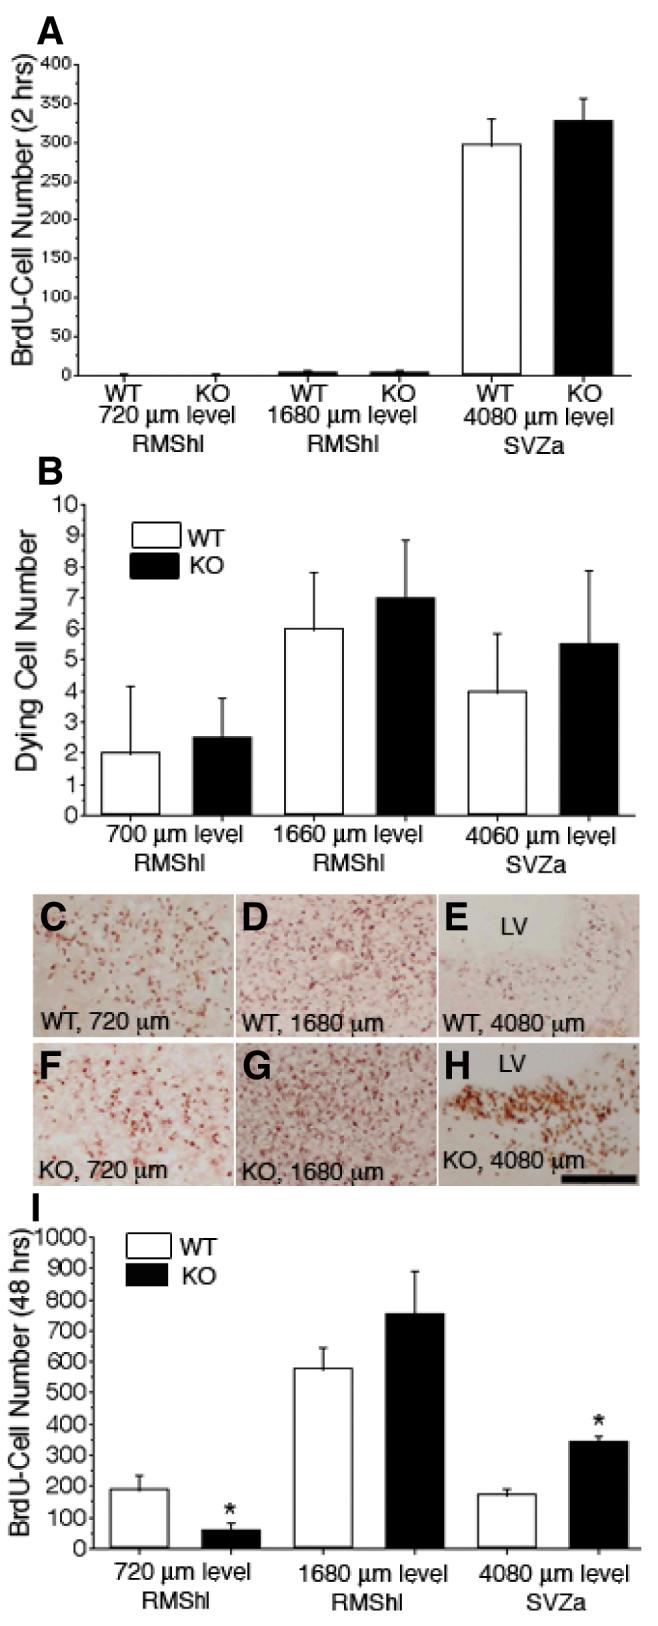
Fig. 4.

Delayed tangential migration in the ADAM2 knockout (KO) rostral migratory stream (RMS). P10 postnates were injected with bromodeoxyuridine (BrdU), killed 2 h later, and then fixed for BrdU and stained with an anti-single-stranded DNA antibody to evaluate proliferative activity and cell death of neuroblasts, respectively. Neuroblasts migration in vivo was estimated in P8 postnatal mice by injecting BrdU, killing 48 h later and fixing for BrdU immunohistochemistry. In both wild-type (WT) and KO P10 mice, serial frontal sections (20 μm thickness each) from the frontal tip of the olfactory bulb (OB) to the anterior part of the subventricular zone (SVZa) were collected and stained with an anti-BrdU antibody or anti-single-stranded DNA antibody. The number of BrdU-positive cells (BrdU-cells) was evaluated on sections at 240 μm intervals. In each image, the right side is toward the dorsal part of the forebrain. (A) Neuroblast proliferative activity was estimated from the number of BrdU-cells (2 h after injection) from WT and KO mice at the same distance between the frontal tip of the OB and the SVZa. Each value represents the mean ± SD (N = 4 from four mice); there are no statistical differences (P < 0.05). (B) The number of dying neuroblasts in the RMS from WT and KO mice was compared at the same distance between the frontal tip of the OB and the SVZa. Each value represents the mean ± SD (N = 4 from four mice); there were no statistically significant differences (P <= 0.05). (C—E) WT. Representative sections at the end portion of the RMS (720 μm level), horizontal limb of the RMS (RMShl; 1680 μm level) and SVZa (4080 μm level) from the frontal tip of the OB are shown. BrdU-cells (48 h after injection) were concentrated in the RMS. At the SVZa level in (E), few BrdU-cells are seen. (F—H) KO. Sections are at the same levels shown in (C—E). In (F), the BrdU-cell density (48 h after injection) is low compared with WT (C). At the 1680 μm level, the section from the KO mice shows significant numbers of BrdU-cells (G), and at the SVZa level, many BrdU-cells are seen (H). (I) The number of BrdU-cells (48 h after injection) from WT and KO mice were compared at the same levels from the frontal tip of the OB to the SVZa. At the rostral part of the RMS, the KO mice show fewer BrdU-cells than that from WT mice; however, at the mid portion between the RMShl and the SVZa, KO mice have more cells than WT. Each value represents the mean ± SD (N = 4 from four mice); the differences at the 720 μm and 4080 μm levels are significant (indicated by asterisks, P < 0.05). LV, lateral ventricle; RMShl, horizontal limb region of the RMS. Scale bar: 500 μm.
