
Figure 5.
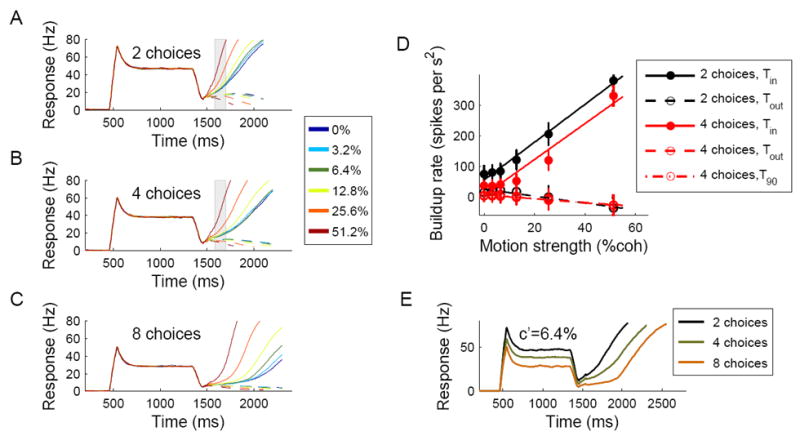
Time course of neural firing and activity buildup during the decision process. (A-C) Activity of neurons located around the selected target (solid lines) and in the opposite direction (dashed lines) during simulations with 2, 4 and 8 choices, respectively. Different colors denote different coherence levels. Each plot was obtained by averaging neural activity over 200 correct trials. (D) Activity buildup rates with 2 and 4 choices, calculated over the epoch indicated by a shaded rectangle in (A) and (B). The buildup rate for neurons located around the selected target increased quasi-linearly as a function of the coherence level. Increasing the number of choices from 2 to 4 resulted in lower buildup rates, but the slope of the buildup vs. coherence remains approximately unchanged, as observed in LIP neurons in the monkey experiment (Churchland et al., 2008). (E) Activity of neurons around the selected target during simulations with 6.4% coherence and different number of targets. Similar to findings from LIP neurons, the spiking response to the targets was reduced when the number of targets was increased, resulting in a lower dip of activity and larger excursion from baseline to threshold during motion stimulus presentation.