
Figure 7.
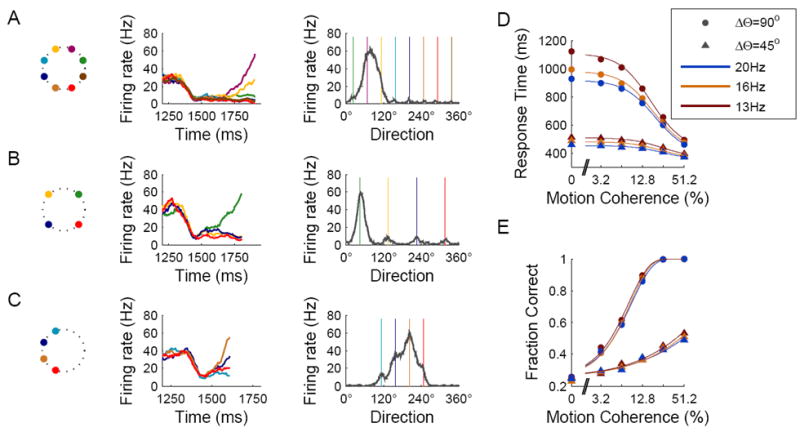
Similarity effect and overlaps in the neural representation of targets. (A-C) Responses during sample simulation with 8 targets separated by 45° (A), 4 targets separated by 90° (B), and 4 targets separated by 45° (C). Left: Schematic illustration of target locations. Middle: Activity dynamics of neural pools located around the targets (color coding as in Fig. 3). Right: Activity profile at the decision time (colored lines indicate target locations). In many of the simulations with 45° separation (panels A and C; see text) activity buildup occurred around more than one target, resulting in merging of activity-bumps around adjacent targets. (D,E) Response times (D) and performance (E) as a function of motion coherence for 4 targets separated by either 90° (dots) or 45° (triangles). In the 45° targets separation case, recurrent excitation between neural pools that were involved in merging of activity buildup resulted in acceleration of the network dynamics. Different colors denote three magnitudes of the control signal, which can be used to adjust response times and performance.