
Figure 2.
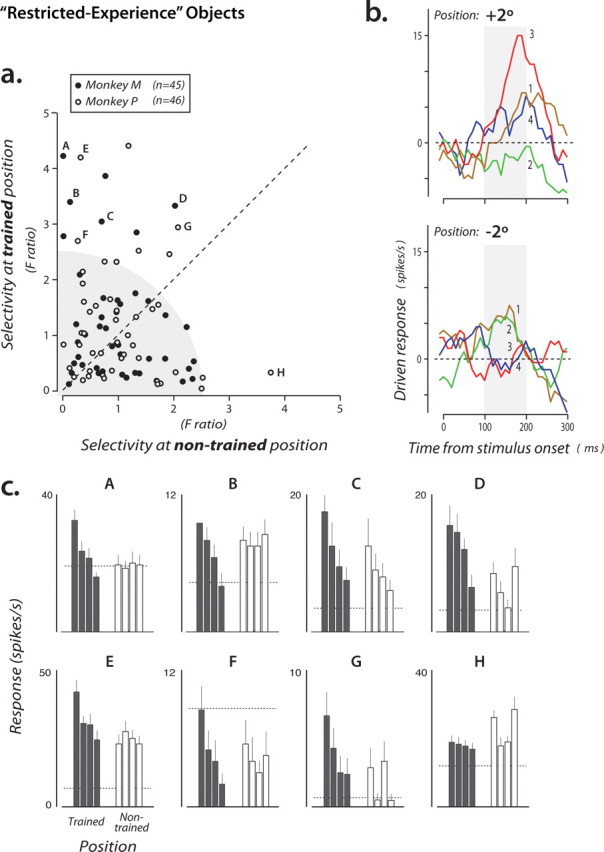
Selectivity of the entire population of IT neurons among the restricted-experience objects. a, Each point shows the selectivity of a single IT neuron measured at both the trained position (ordinate) and the nontrained position (abscissa). Selectivity was computed using a standard index that takes into account all of the response data for these objects collected at each position (F ratio) (see Materials and Methods). The gray region highlights the fact that many IT neurons had little or no selectivity among these objects (see Results). b, Driven responses of an IT neuron (indicated by letter “A” in a) that showed selectivity at the trained position (+2° for this monkey), but little selectivity at the nontrained position (−2°). Each line shows the average poststimulus spiking response to each object (presented at time 0 for 100 ms duration) (Fig. 1b) (a 100 ms sliding boxcar is applied to the binned spike counts). Object identity is indicated by color (and the numbers refer to the object identity numbers shown in Fig. 1a). Gray boxes indicate the standard time window used for all analyses (see Materials and Methods). c, Data from eight example neurons (indicated by letters in a). Each plot shows the mean response of one neuron to each of the four objects presented in each position (filled bars, trained position; open bars, nontrained position). Dashed line is mean firing rate in the 100 ms window on each trial just before stimuli were presented. For clarity, in each plot, object identity is rank-ordered according to the response in the trained position (different neurons generally prefer different objects) (data not shown here), and the same object identity order is used for the nontrained position.