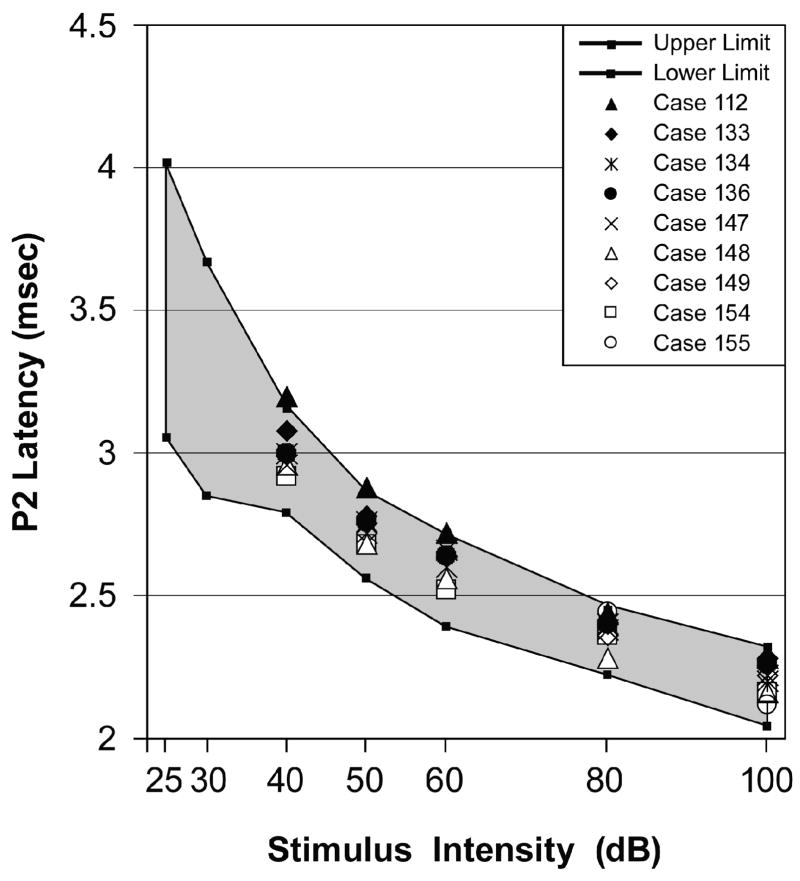
Fig. 4.
ABR latency-intensity (L-I) profiles for each Excess animal that had an elevated ABR threshold in response to the 8 kHz tone pip condition. The shaded region is the range of normalcy for the P2 wave’s latency (mean ± 2 SD) as derived from the Control group data. Each of these Excess animals had L-I profiles that fell within the range of normalcy with the exception that they did not have ABRs below 40 dB.

