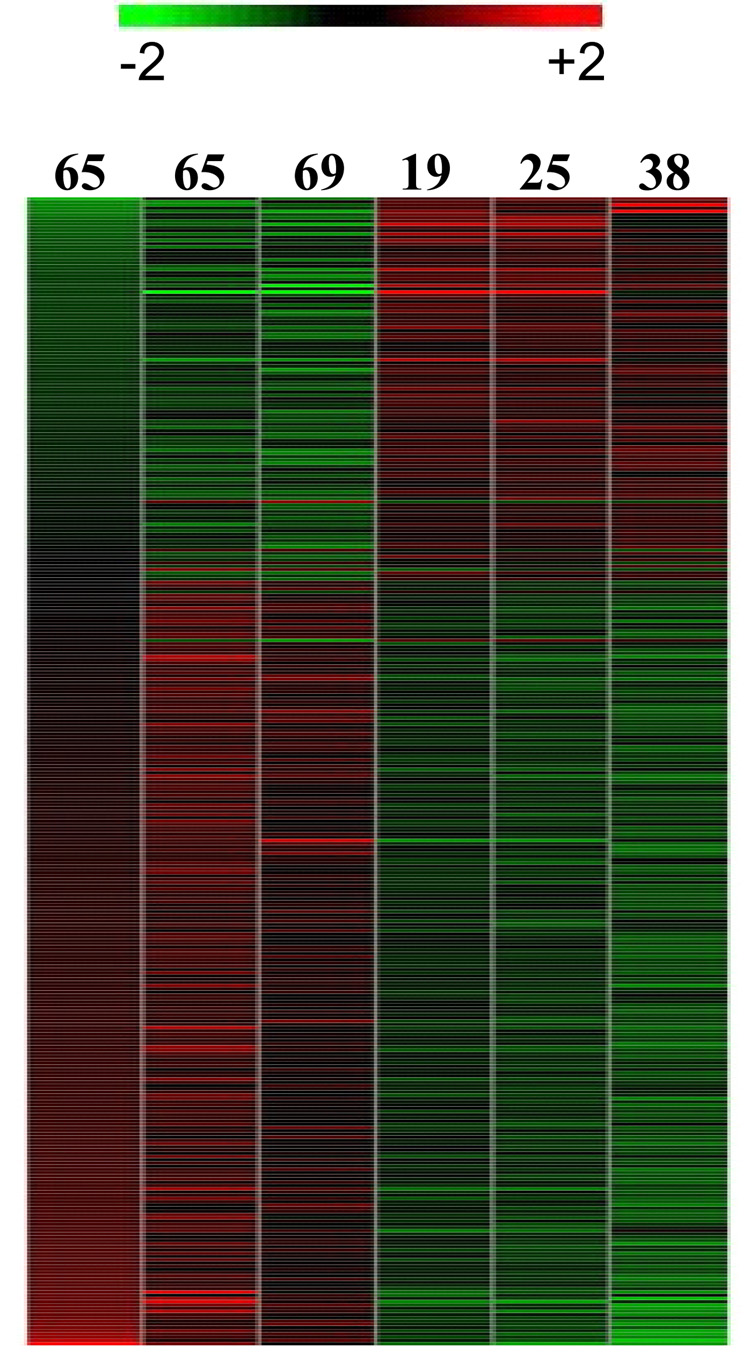
Figure 1.
Heat map of 228 differentially expressed genes comparing RNA samples from female human parotid of different age groups. The age is noted on each lane. Red represents relative expression greater than the median expression level across all samples, and green represents an expression level lower than the median. Black indicates intermediate expression.

