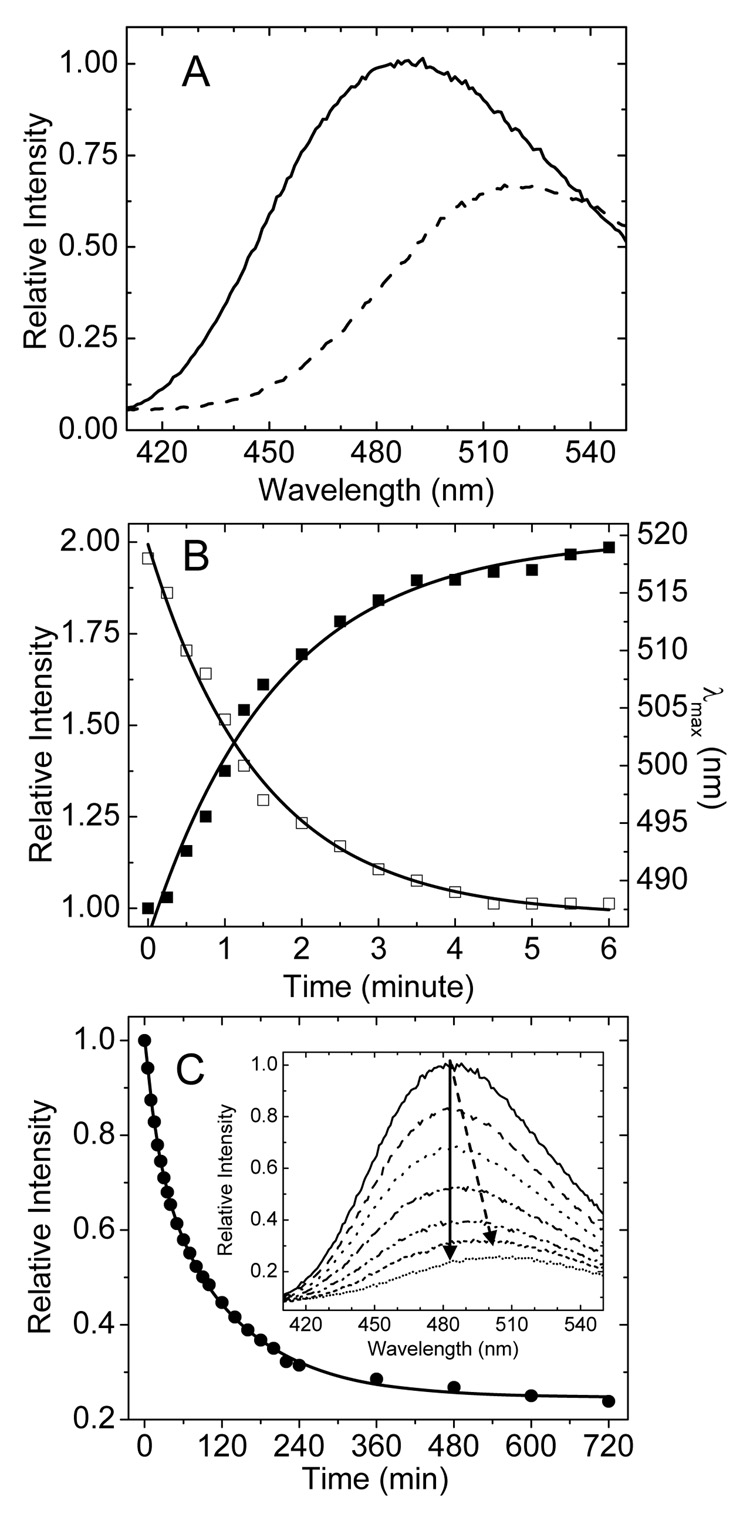
Fig.1.
Changes in fluorescence emission spectra during extraction and release of dansyl-DHPE. (A) The fluorescence emission spectra of 0.2 µM GM2AP:dansyl-DHPE complex (solid line) and 1 µM POPC:dansyl-DHPE (4:1) vesicles (dashed line). The spectra were recorded on a FLUOROMAX-3 fluorometer with excitation at 340 nm with a 90° and a 0° orientation of the excitation and emission polarizer, respectively. All experiments were performed at 20°C by using a water bath circulator. GM2AP functions in the acidic compartment of the lysosome; therefore all studies herein are performed in 50 mM sodium acetate buffer at pH 4.8 (B) Plots of the relative emission intensity at 484 nm (filled squares) and the value of maximal emission wavelength (λmax) (open square) as a function of time during the extraction of dansyl-DHPE from 1 µM(final concentration) POPC:dansyl-DHPE (4:1) vesicles by GM2AP. GM2AP was added to 5 µM final concentration. Solid lines show fits to a first order single exponential rate process. (C) Plot of the relative emission intensity as a function of time for the release of dansyl-DHPE from 0.25 µM GM2AP:dansyl-DHPE complex with 20 µM POPC vesicles present (filled circle). The solid line is the best fit to a two-component first order processes. The inset plots representative spectra over a 600 minute time period showing how the spectral intensity decreases and the wavelength red shifts overtime (indicted by the arrows).

