
Figure 1.
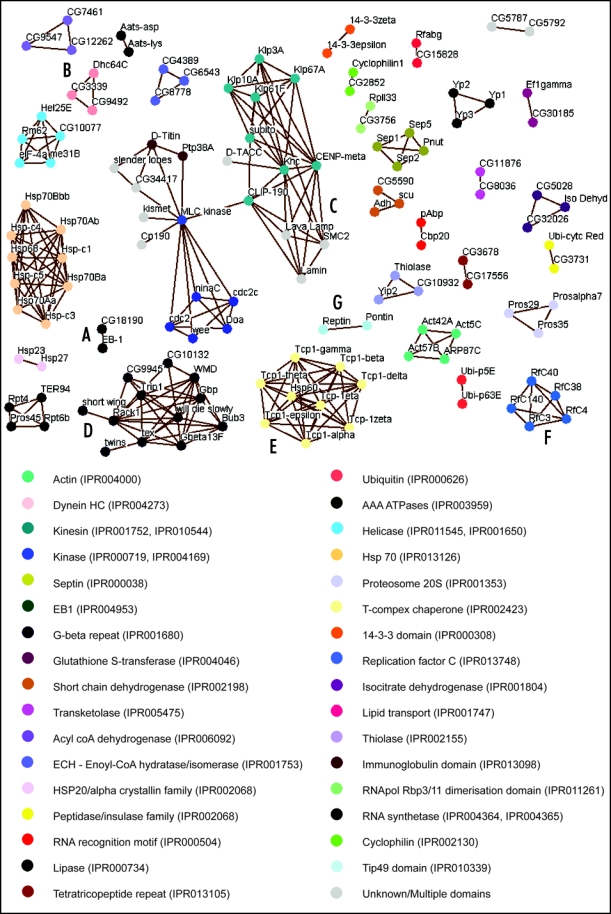
(See page 48) Network diagram showing MAPs with aligned sequences. All reciprocally aligned proteins sequences are visualised by way of this network diagram using Osprey version 1.0.1.29 Nodes represent proteins while edges indicate the reciprocal alignment with e-value less than 1E-03. Domains and family groups are identified as InterPro codes30 and all relevant protein domains are listed for each protein (Table S1). Functional domains and families of each protein are indicated by the node coloring defined by the key.