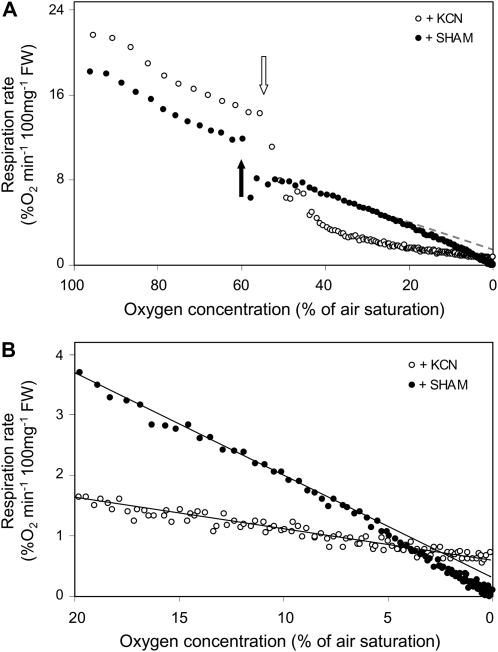
Figure 5.
Effect of respiratory inhibitors SHAM (black symbols) and KCN (white symbols) on the rate of respiratory oxygen consumption while the oxygen availability declines. A, The full profile of respiration from full saturation (100% of air saturation) of the incubation solution to full depletion (0% of air saturation). Inhibitors were added as indicated by the arrows in the figure. The gray dotted line fits to the linear part of the graph representing the cytochrome c pathway. B, The same data as in A, but scales on the horizontal and vertical axis are adjusted such that the low oxygen response can be observed more precisely. The experimental setup is as described for Figure 3. The graphs show the values of representative experiments that were repeated at least three times.

