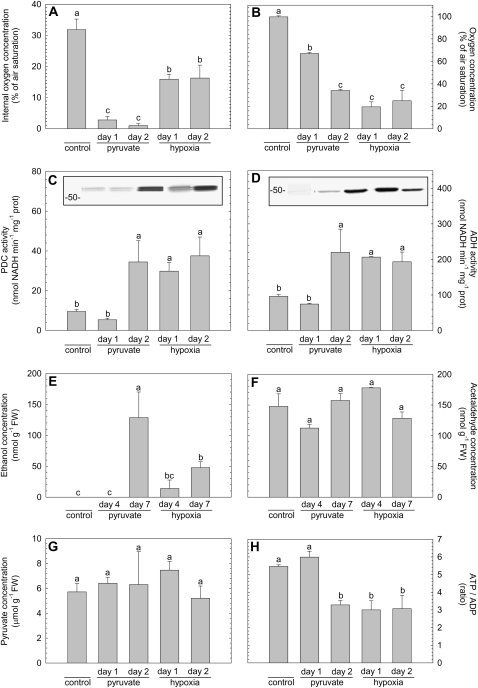
Figure 6.
Overview of the effect of hypoxia or pyruvate supplementation on various parameters that are suggested to be linked with the induction of fermentation in pea roots: internal oxygen concentration as measured in the middle of a root (A), oxygen concentration in the nutrient solution (B), PDC activity (C), ADH activity (D), the concentration of ethanol inside the root tissue (E), the concentration of acetaldehyde within the root tissue (F), the concentration of pyruvate within the root tissue (G), and the ratio of ATP to ADP as a measure for the energy status of the tissue (H). The insets in graphs C and D represent immunoblots showing the protein abundance of, respectively, PDC and ADH. Samples from the various treatments were taken 24 h (day 1) and 48 h (day 2) after addition of pyruvate to air-saturated nutrient solution (bars are labeled with pyruvate) or after switching to a nutrient solution with an oxygen concentration of 25% of air saturation (bars labeled with hypoxia). Control plants grew in air-saturated nutrient solution and samples from these plants were taken shortly before the experimental treatments started. Further control samples were taken during the course of the experiment, simultaneously with the samples taken from the various treatments. Because the control samples did not show any significant variation, the mean value of all control samples was calculated and given in the figure. The samples used for ethanol (A) or acetaldehyde (F) determination were taken 4 and 7 d after the pyruvate or hypoxic treatment started. The bars represent the average of at least three measurements ± se. Different letters mark mean values that are significantly different from each other (ANOVA; P < 0.05).

