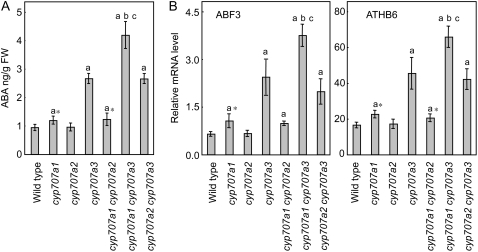
Figure 4.
Phenotypic analysis of the cyp707a mutants in high-humidity conditions. A, ABA levels of the cyp707a mutants under high-humidity conditions for 1 h. B, Expression of ABA-responsive genes in cyp707a single and double mutants under high-humidity conditions for 1 h. ABF3 and ATHB6 expression in cyp707a mutants are shown in right and left graph, respectively. Experiments were performed at least four times and an average is shown with se. A lowercase letter indicates a significant difference judged by Student's t test. a, b, and c indicate the significant difference (P < 0.01) relative to wild type, cyp707a1-1 mutant, and cyp707a3-1 mutant, respectively. An asterisk indicates the significant difference when less stringent cutoff value was used (P < 0.05).

