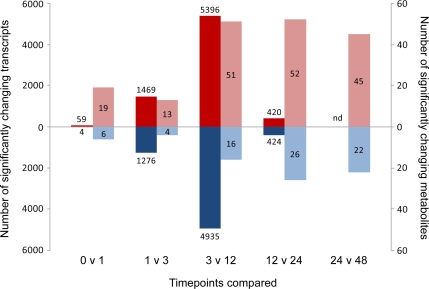
Figure 1.
Summary of the number of significant changes in transcripts and metabolites between successive time points during rice germination. Transcript and metabolite profiling were performed on rice embryo tissue samples collected at various time points during germination (0, 1, 3, 12, 24, and 48 HAI). Changes in the abundance of 24,150 transcripts and 126 metabolites were determined, and statistical analysis was performed to evaluate significant differences between all possible combinations of time points (Supplemental Fig. S1). Comparison of successive time points for significantly up-regulated (red) and down-regulated (blue) transcripts (dark red and blue; left axis) and metabolites (light red and blue; right axis) revealed differences in the timing of significant alterations in the transcriptome and metabolome. The numbers of significantly changing transcripts and metabolites for each comparison are given above and within the columns, respectively. nd, Not determined.

