Figure 2.
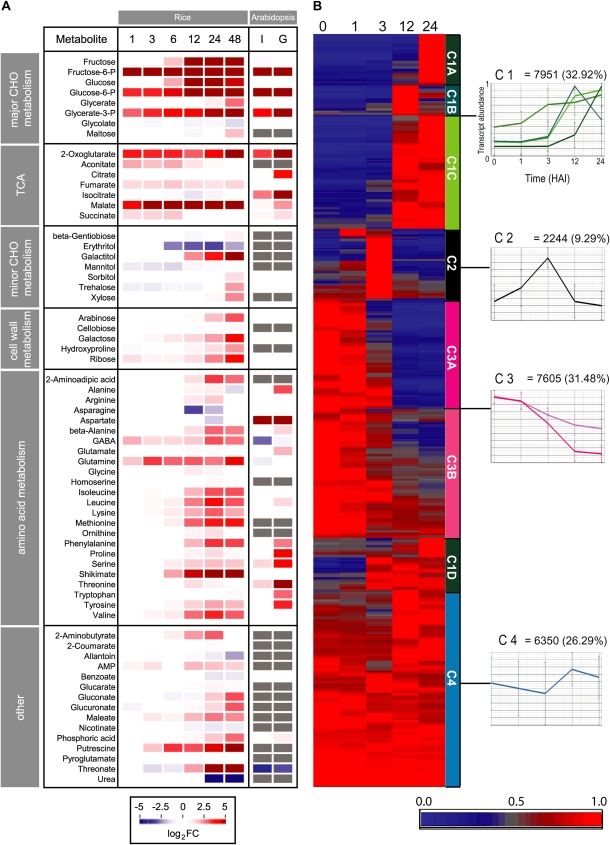
Profiles of known metabolites and hierarchical clustering of differentially expressed genes during rice germination. A, Changes in the levels of all identified metabolites were calculated as fold changes relative to the 0-HAI time point and log transformed. Changes are represented as a false color heat map where the color saturates at a log2 false color (FC) value of 5 (i.e. a 32-fold change). Data from a study performed using whole Arabidopsis seeds (Fait et al., 2006) are included for comparison, where I represents seeds imbibed for 72 h at 4°C in the dark relative to dry seeds and G indicates a comparison of seeds imbibed for 72 h at 4°C in the dark followed by 24 h of growth under germinative conditions (21°C in the light) relative to dry seeds. White coloring indicates no significant change, and gray coloring indicates that a metabolite was not measured. The fold changes for all metabolites detected and associated P values are shown in Supplemental Table S2B. B, From microarray analysis, all probe sets that were called present at a minimum of one time point were normalized to the highest level of expression over the time course of the study and hierarchically clustered using average linkage based on Euclidian distance. Four primary clusters were defined: cluster 1 (green), transcripts that increased in abundance over the time period examined; cluster 2 (black), transcripts that were low or absent at 0 HAI, peaked at 1 or 3 HAI, and then declined in abundance; cluster 3 (pink), transcripts that declined in abundance over the time period examined; cluster 4 (blue), transcripts that displayed relatively stable levels of abundance throughout the time course. Subclusters of clusters 1 and 3 are defined by differences in the time points at which changes in transcript levels occurred. For all clusters, a graph showing the average expression level is presented. Fold changes and their associated P values for all probe sets can be found in Supplemental Table S1.

