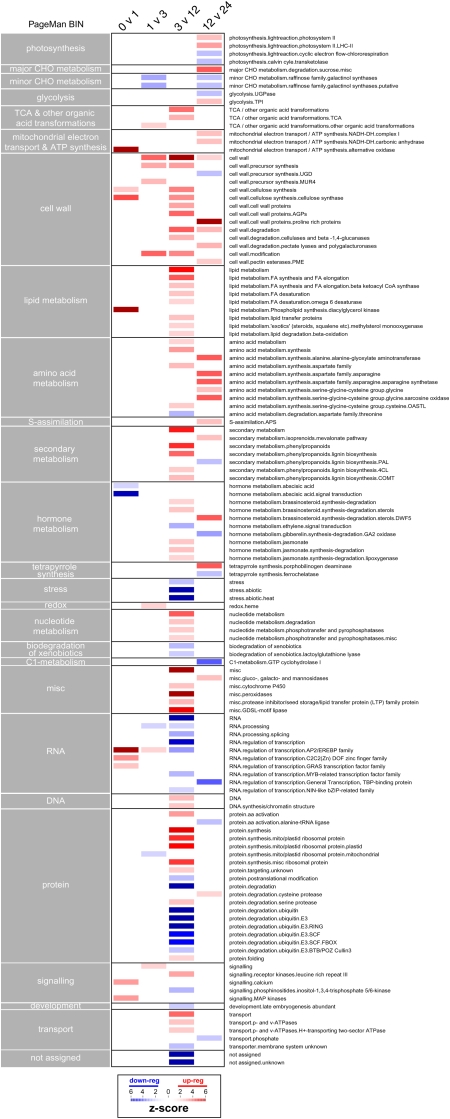
Figure 3.
PageMan analysis of the microarray data over the rice germination time course. Significant fold changes in transcript levels between adjacent time points were log transformed and analyzed using the PageMan tool. Wilcoxon statistical analysis with Benjamini-Hochberg false discovery rate control was performed to determine significantly different gene categories. Nonsignificant categories were collapsed for display. Statistical differences are represented by a false color heat map (red = up-regulated; blue = down-regulated) where a z-score of 1.96 represents a false discovery rate-corrected P value of 0.05.

