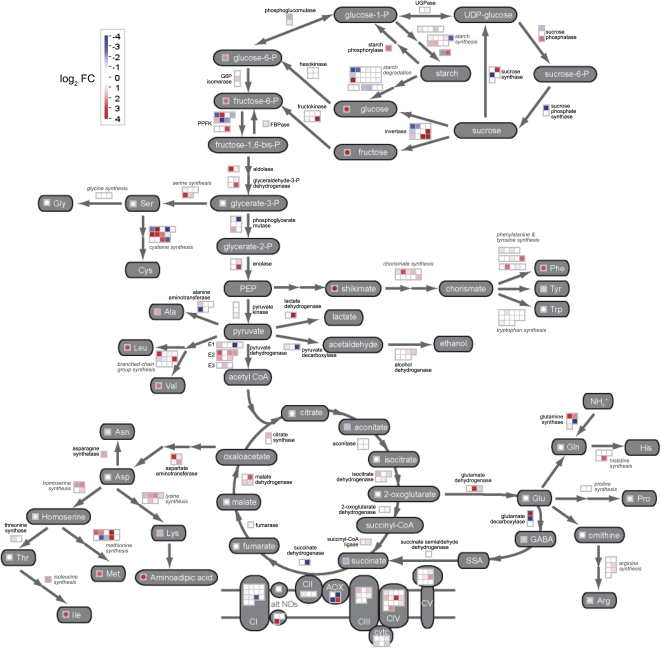
Figure 4.
Parallel display of transcripts and metabolites for starch-Suc metabolism, glycolysis, the TCA cycle, GABA shunt, mitochondrial respiratory chain, and amino acid metabolism. Significant fold changes in transcripts and metabolites were log transformed and displayed on a custom pathway picture using the MapMan tool. Where possible, metabolite changes are indicated in the circles next to the corresponding metabolite name (gray boxes) and correspond to a comparison of 6 and 24 HAI. Enzymatic conversions between metabolites are indicated by arrows and enzyme names. Changes in transcripts encoding these enzymes are indicated in the boxes next to the enzyme names and correspond to the 3- versus 12-HAI comparison. In most cases, the enzymes involved are encoded by a small gene family. However, in some cases, individual enzymes are not distinguished and a more general classification of the contributing transcripts is indicated in italics (e.g. starch degradation). This is also the case for components of the mitochondrial electron transport chain (CI–CV), where transcript levels for different nucleus-encoded subunits are presented. For both metabolites and transcripts, changes are represented by shading, where the color saturates at a log2 false color (FC) value of 4 (i.e. a 16-fold change).

