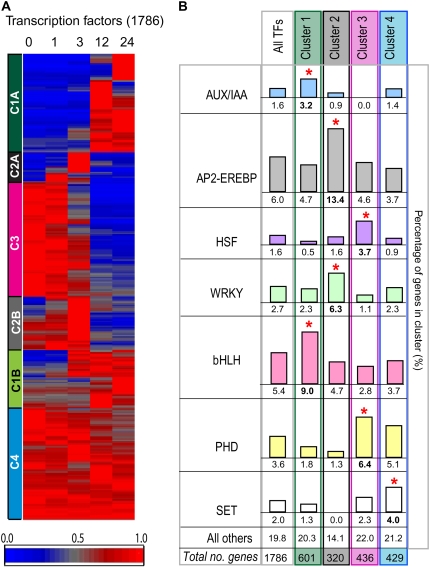
Figure 7.
Analysis of changes in transcript abundance for genes encoding transcription factors. A, Hierarchical clustering of 1,786 transcription factors that were present at a minimum of one time point, divided into four clusters as in Figure 3. B, Analysis of the transcription factors by family present in each cluster. Overrepresentation is indicated by red asterisks. The frequency of transcripts, percentage breakdown in each cluster, and the significance score are shown in Supplemental Table S4B.

