Figure 1.
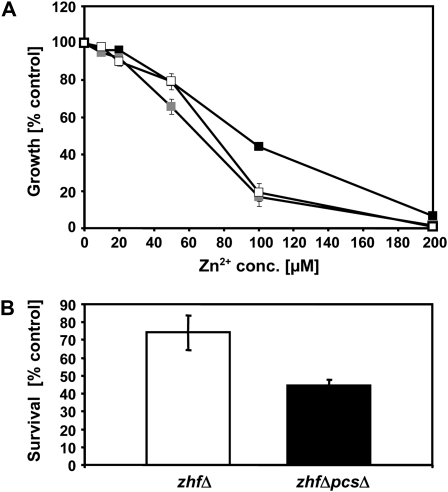
Synthesis of PCs contributes to Zn2+ tolerance in S. pombe. A, Growth of zhfΔ (white squares), zhfΔpcsΔ (black squares), and zhfΔhmt1Δ (gray squares) S. pombe mutant cells in the presence of different Zn2+ concentrations (conc.). Growth is shown as percent of growth of control cells in the absence of added Zn2+. Error bars indicate sd, n = 4. B, For Zn shock experiments zhfΔ (white bar) and zhfΔpcsΔ (black bar) were exposed to a highly toxic Zn2+ dose (400 μm for 4 h). Zn shock tolerance is expressed as percent cell survival compared to untreated cells. Error bars indicate sd, n = 3.

