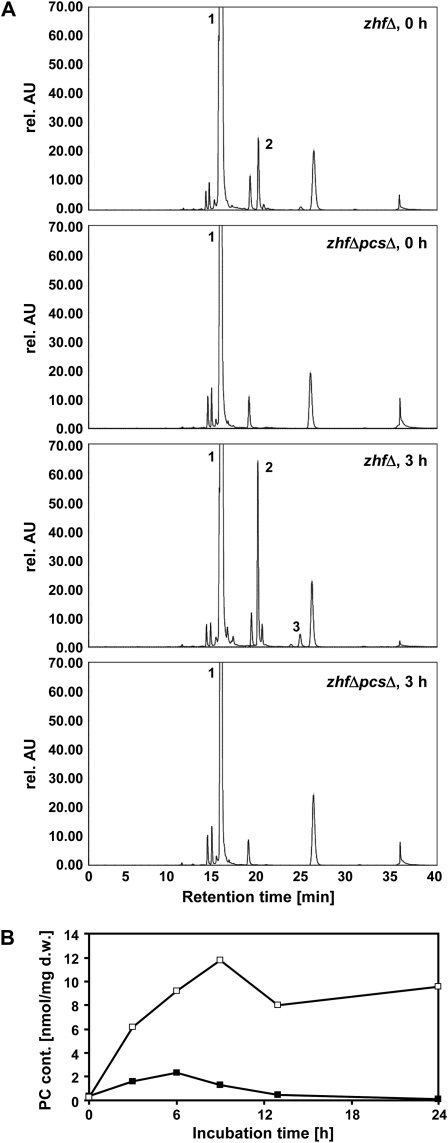
Figure 2.
Zn2+ exposure activates PC accumulation in zhfΔ cells. zhfΔ and zhfΔpcsΔ cells were exposed to excess Zn2+ for 3 h. Extracts were analyzed by HPLC subsequent to thiol labeling with monobromobimane. Peak 1: glutathione, peak 2: PC2, peak 3: PC3. Other peaks are either derived from monobromobimane (peaks at retention times 27 and 36 min) or unidentified. rel. AU, Relative absorption units. B, zhfΔ cells were at an OD600 of 0.6 treated with either 0.5 mm Zn2+ (black squares) or 1 mm Cd2+ (white squares) and incubated for 24 h. Aliquots were taken at different time points and analyzed by HPLC. PCs were quantified based on standard curves for PC2 and PC3. Shown are the results of a typical experiment. Three biological replicates were performed with comparable results. d.w., Dry weight.

